Figure 4.
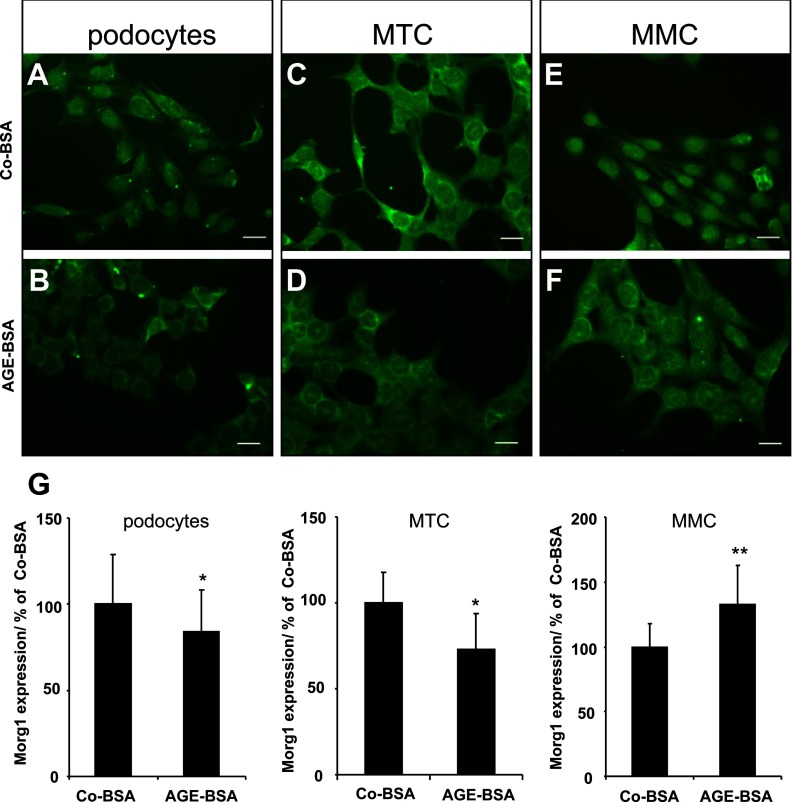
A–G, Cellular distribution of Morg1 protein in renal cells treated with Co-BSA and AGE-BSA. Morg1 cellular localization was analyzed in podocytes, MTCs, and MMCs. Cells were plated in chamber slides and were stimulated for 24 hours with Co-BSA or AGE-BSA. Morg1 expression was detected by immunofluorescence. Morg1 localization was analyzed using Zeiss, an Axioplan fluorescent microscope, and AxioVision software. Representative images of Co-BSA- and AGE-BSA-treated cells are shown. Bar, 20 μm (n = 6). A, Morg1 localization in podocytes stimulated with Co-BSA. B, Morg1 cellular distribution in AGE-BSA-treated podocytes (n = 6). C, Morg1 localization in MTCs stimulated with Co-BSA (n = 6). D, Morg1 cellular distribution in AGE-BSA-treated MTCs (n = 6). E, Morg1 localization in MMCs stimulated with Co-BSA (n = 6). F, Morg1 cellular distribution in AGE-BSA-treated MMCs (n = 6). G, Densitometry quantification of Morg1 immunological staining in differentiated podocytes, MTCs, and MMCs. The relative intensity of Morg1 protein is presented in percentage relative to Co-BSA. *, P < .005; **, P < .003 (n = 6).

