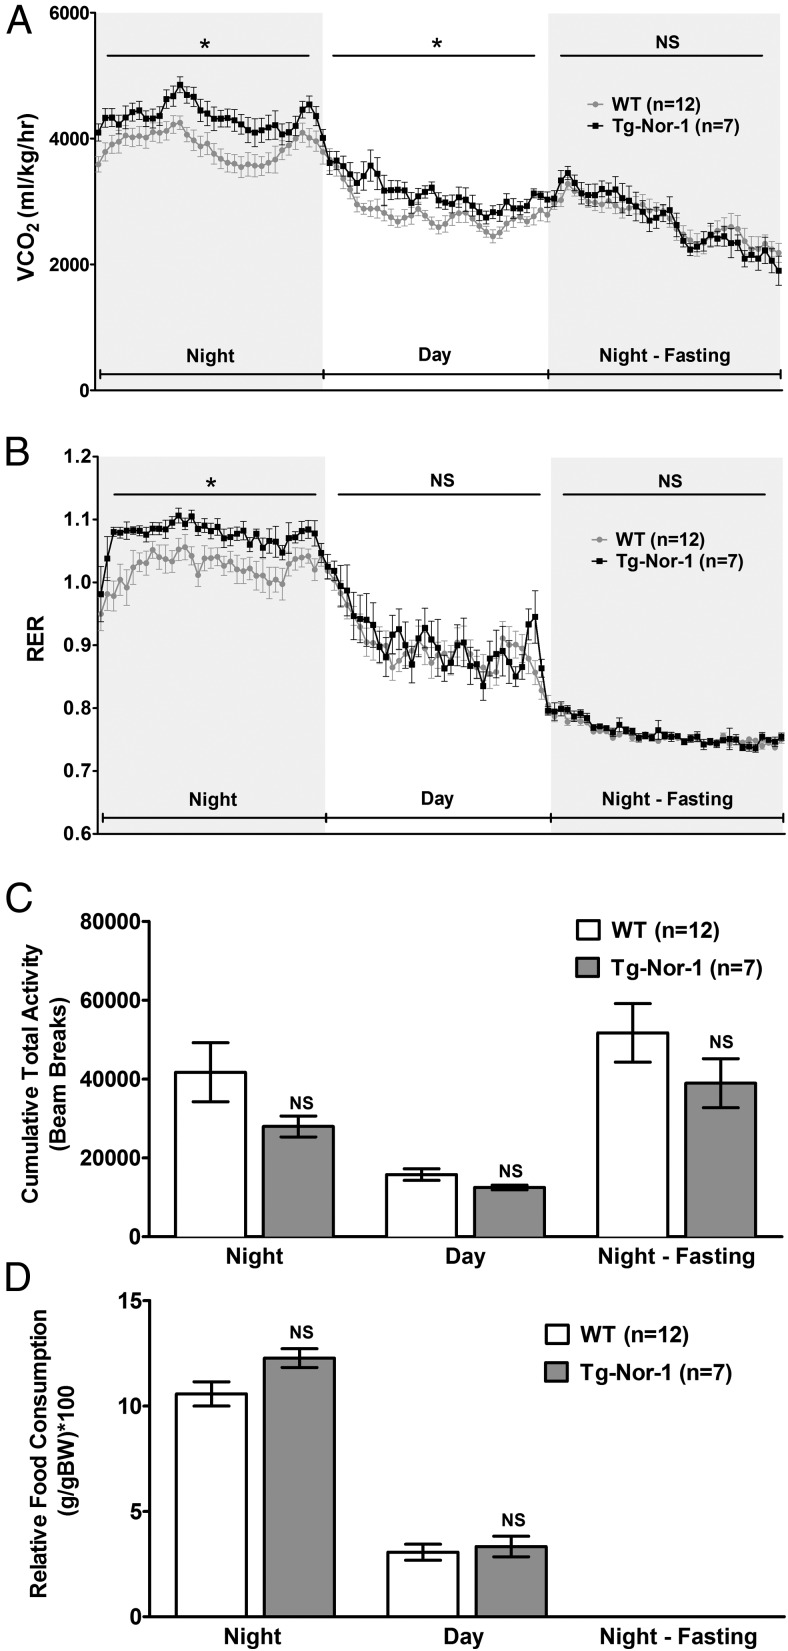
Figure 2.
Metabolic profiling of Tg-Nor-1 mice. A and B, CO2 production (corrected for body weight) (A) and RER in WT and Tg-Nor-1 mice (n = 7–12) (B). Data were analyzed using repeated-measures two-way ANOVA. C, Cumulative total activity of the mice measured by horizontal beam breaks. D, Relative food consumption (corrected for body weight) analyzed by one-way ANOVA with column selected Bonferroni post hoc analysis. *, P < .05.

