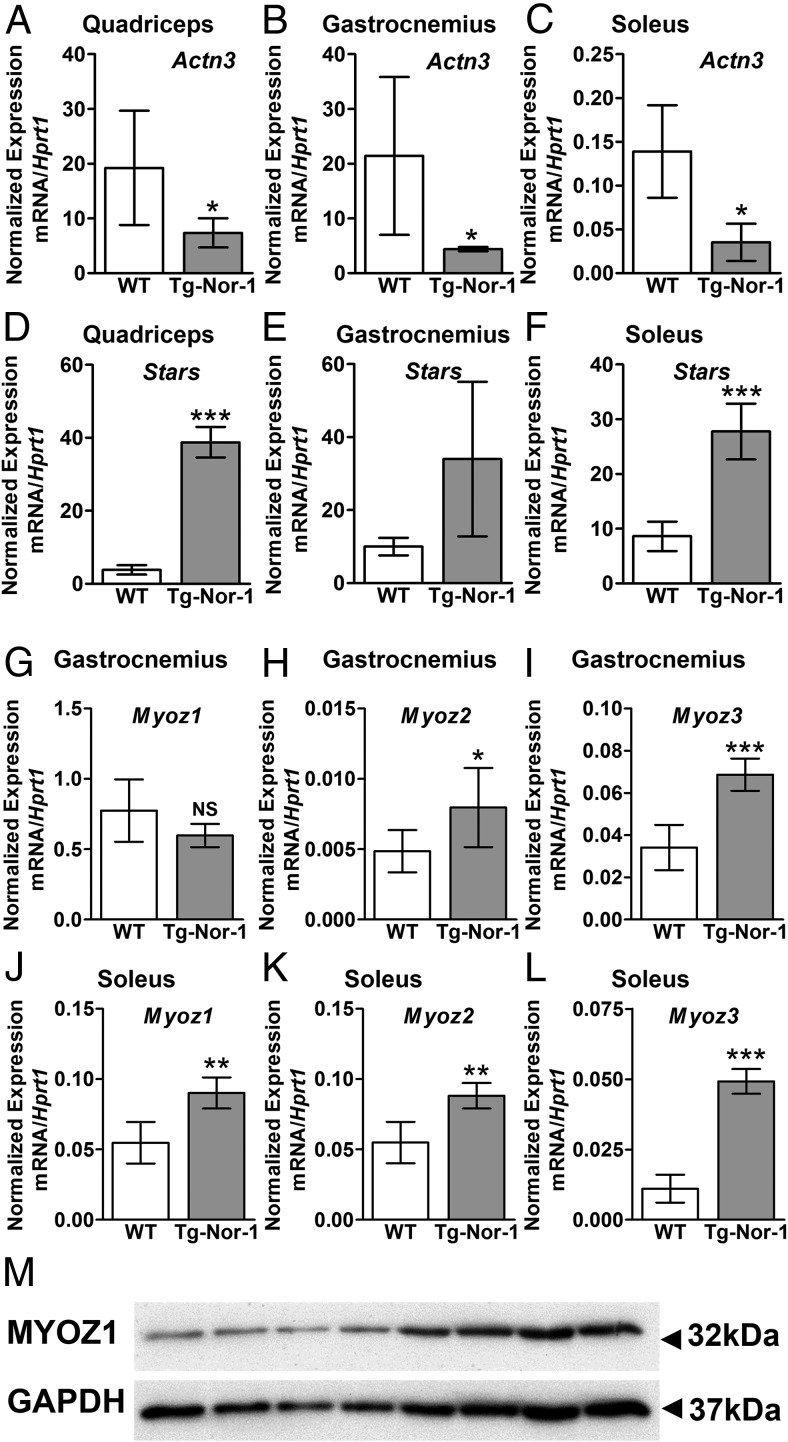
Figure 7.
Expression of sarcomeric genes by Tg-Nor-1 mice. A–C, Expression of Actn3 in quadriceps femoris (A), gastrocnemius (B), and soleus (C) via RT-qPCR (n = 4). D–F, Expression of Stars in quadriceps femoris (F), gastrocnemius (E), and soleus (F) via RT-qPCR (n = 4). G–I, Expression of Myoz1 (G), Myoz2 (H), and Myoz3 (I) in gastrocnemius via RT-qPCR (n = 4–8). J–L, Expression of Myoz1 (J), Myoz2 (K), and Myoz3 (L) in soleus via RT-qPCR (n = 4–8). Statistical calculation was performed using a Student t test, and P values are indicated on graphs as follows: *, P < .05; **, P < .01; ***, P < .001. M, Western blot analysis of MyOZ1 on quadriceps femoris muscle (n = 4).

