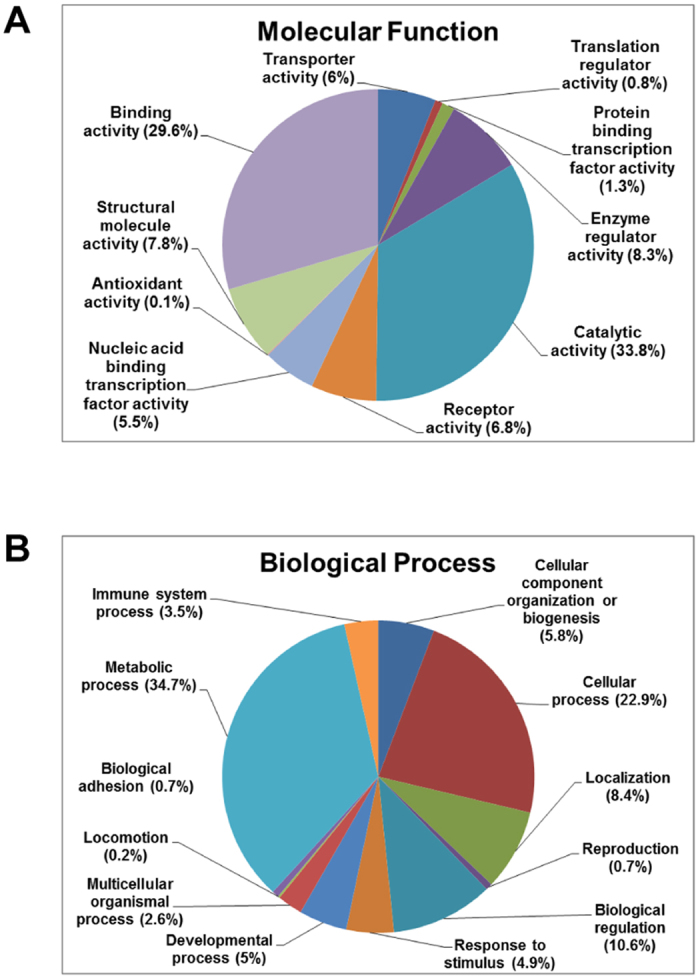
Figure 3.

Functional categorization of the proteins that are up-regulated or down-regulated in ganetespib-treated bladder cancer cells. Differentially regulated proteins were analyzed for “functional categories” using the UnitProt knowledge database and the PANTHER classification system. Pie charts display the distribution of ≥2-fold up-regulated proteins detected in the ganetespib-treated 5637 cells based on molecular function (A) and ≥2-fold down-regulated proteins detected in the ganetespib-treated 5637 cells based on biological process (B). The percentages of the identified and quantified proteins in each category are indicated in parentheses.
