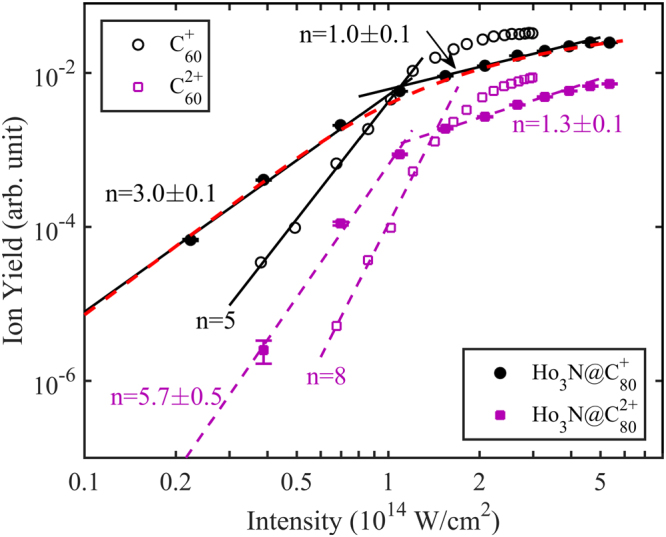
Figure 2.

Comparison of the ion yield dependence on peak intensity for the ionization of Ho3N@C80 q+ (q = 1, 2) (filled symbols) and C60 q+ (q = 1, 2) (open symbols). The Ho3N@C80 q+ results are extracted from data in Fig. 1 and the yields of Ho3N@C80 with a charge q = 1 is multiplied by 5. The C60 data are from ref. 40 and the C60 + yield was multiplied by 2 for clarity.
