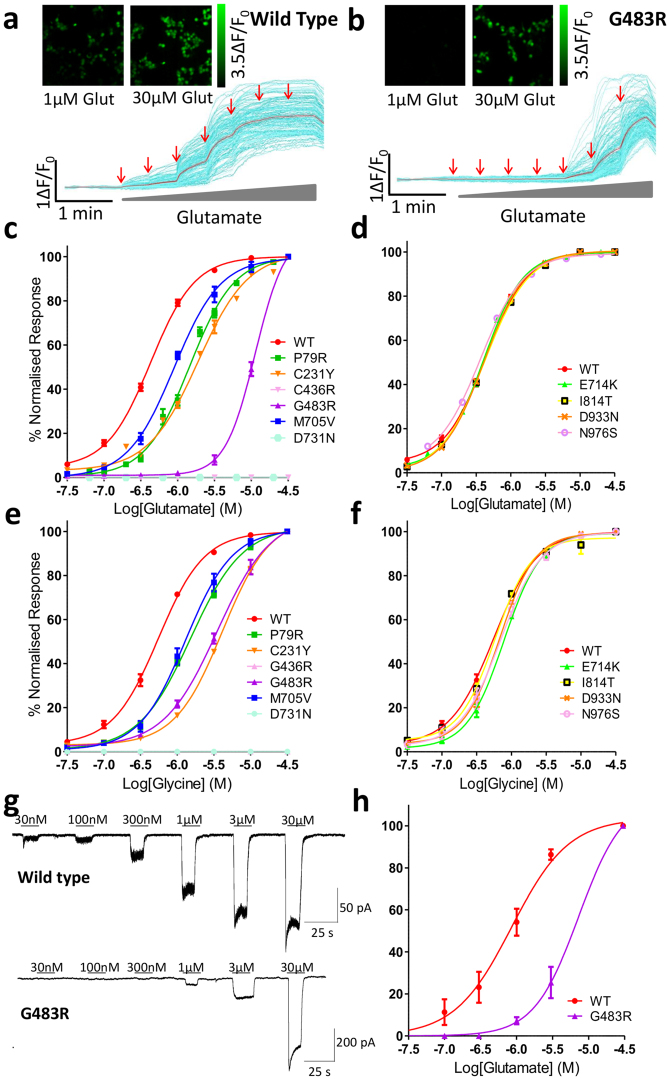
Figure 3.
GRIN2A mutations alter the response to glutamate and glycine. (a,b) Pseudocolour images and representative single-cell traces from calcium-flux imaging for HEK cells transfected with either WT or G483R GRIN2A showing different calcium responses caused by the application of increasing concentrations of glutamate (30 nM–30 µM red arrows). Individual cell traces in cyan and the mean response in red. (c,d) Normalised concentration response curves (CRCs) to increasing concentrations of glutamate from single cell calcium-flux imaging. In (c) 4 mutants; P79R, C231Y, C483R and M705V have reduced agonist potency, while C436R and D731N show no response to glutamate. Four mutant constructs (d), show an unaltered response to glutamate. (e,f) Normalised CRCs to increasing glycine concentration with constant 3 µM glutamate – the mutations show similar responses as to glutamate. See Table 2 for n to create averaged data per construct, 3 × 10⁴ cells/well. Error bars ± SEM. (g) Representative continuous voltage-clamp recordings obtained from HEK cells transfected with WT or G483R GRIN2A plasmid. Bars above the recording indicate glutamate application (co-applied with 30 µM glycine). Application of increasing concentrations of glutamate shows a progressive increase in current observed, the sensitivity of which is shifted to higher concentrations of glutamate in the G483R mutant compared to WT. (h) Normalised CRC to glutamate as recorded in (g) indicates the same response as for single cell calcium imaging (n = 3).

