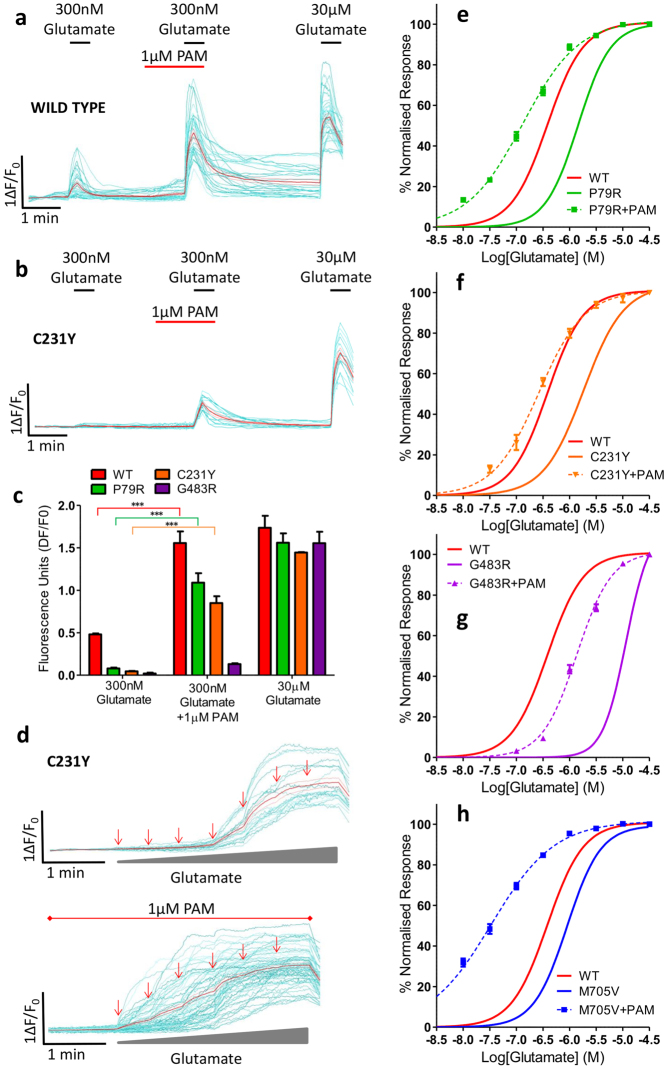
Figure 6.
Pharmacological rescue of functional deficits can be achieved for selected GRIN2A mutants. Examples of single-cell imaging of HEK transfected with (a) WT and (b) C231Y mutant showing calcium-influx response to 300 nM glutamate before and after incubation with 1 µM PAM and in comparison to maximal 30 µM glutamate. (c) Graph of single cell imaging data showing response of WT and mutants P79R, C231Y and G483R to 300 nM glutamate with and without 1 µM PAM. Bonferroni corrected ANOVA ***p < 0.001, n = 15 wells (over 3 assays) for each construct, 3 × 10⁴ cells/well. Mean ± SEM. (d) Examples of single cell imaging of HEK transfected with C231Y mutant showing calcium-influx response to increasing concentrations of glutamate (30 nM, 100 nM, 300 nM, 1 µM, 10 µM and 30 µM arrows) top, and below, increasing concentrations of glutamate (30 nM, 100 nM, 300 nM, 1 µM and 30 µM arrows) with constant 1 µM PAM. Individual cell traces displayed in cyan and the mean response shown in red. (e–h) Concentration response curves of mutant (P79R, C231Y, G483R or M705V) GRIN2A transfected in HEK cells to increasing concentrations of glutamate (30 nM to 30 µM) during incubation with 1 µM PAM recorded from single-cell calcium-flux imaging. Each graph shows the response of the WT GRIN2A construct with no PAM in red (curve from Fig. 3c) and the response of the mutant before (solid line) and after (dashed line) the addition of PAM. p < 0.0001 for LogEC50 for each construct + PAM when compared to without PAM addition. Data averaged from n = 12 wells for each construct, 3 × 10⁴ cells/well, (over 3 assays). Error bars ± SEM.

