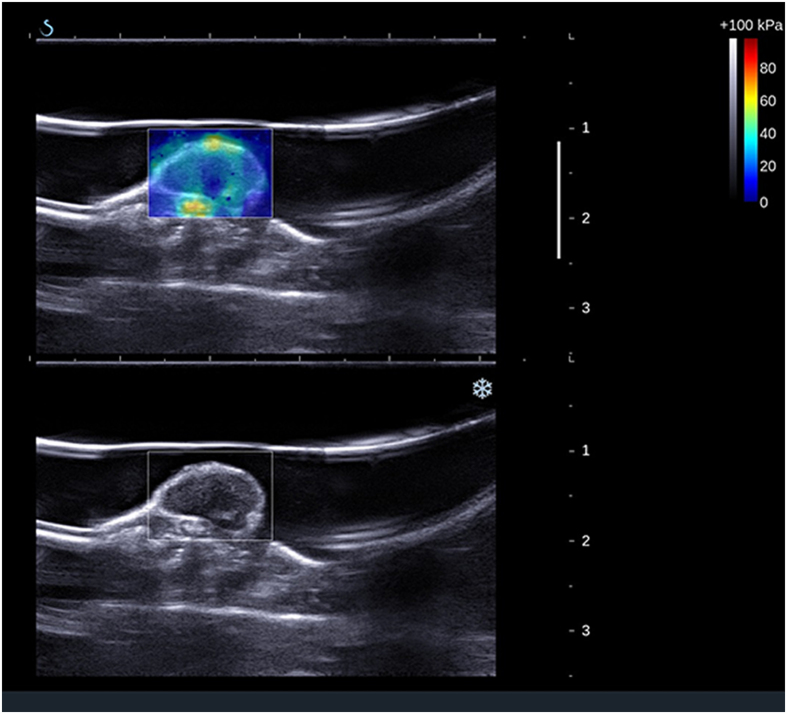
Figure 2.
Image acquisition. B-mode image in sagittal plane of the tumour located on the flank of the mouse with (top panel) and without (bottom panel) the elasticity box. The scale on the right represents depth (cm) and the white line indicates the focus position. The colourmap indicates elastic (Young’s) modulus values in kPa. White line above the tumour is a nylon pocket.

