Figure 4.

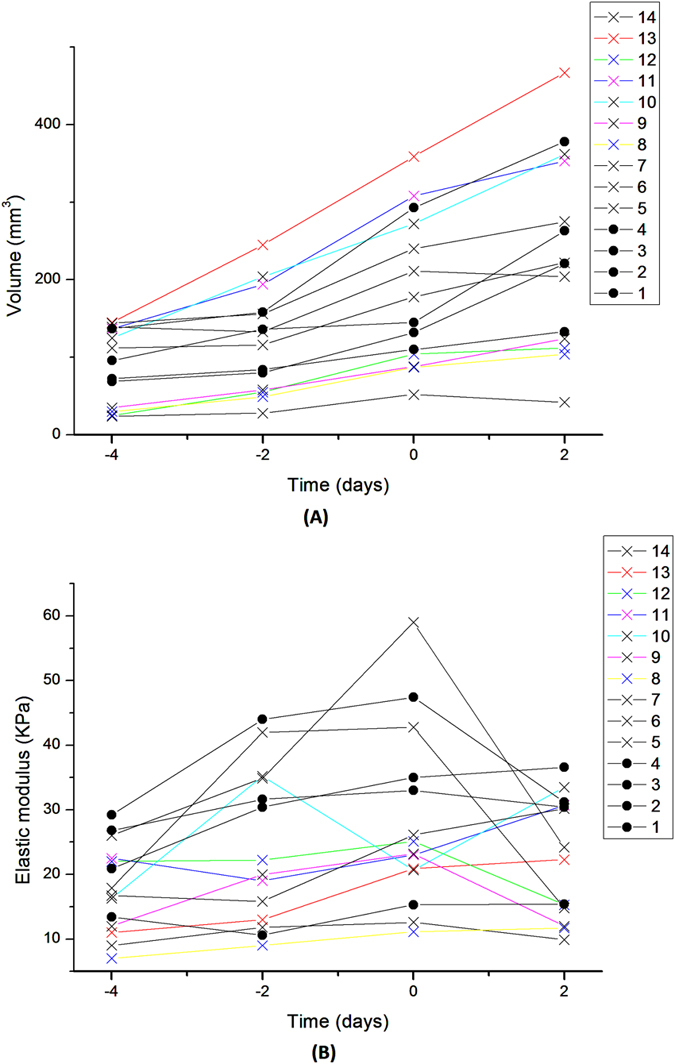
Tumour volume and elastic modulus comparison. Temporal change in tumour volume (A) and tumour elasticity (B). Day 0 corresponds to the point of treatment. Filled circles  indicate control group and crosses
  indicate treated groups.

Tumour volume and elastic modulus comparison. Temporal change in tumour volume (A) and tumour elasticity (B). Day 0 corresponds to the point of treatment. Filled circles  indicate control group and crosses
  indicate treated groups.