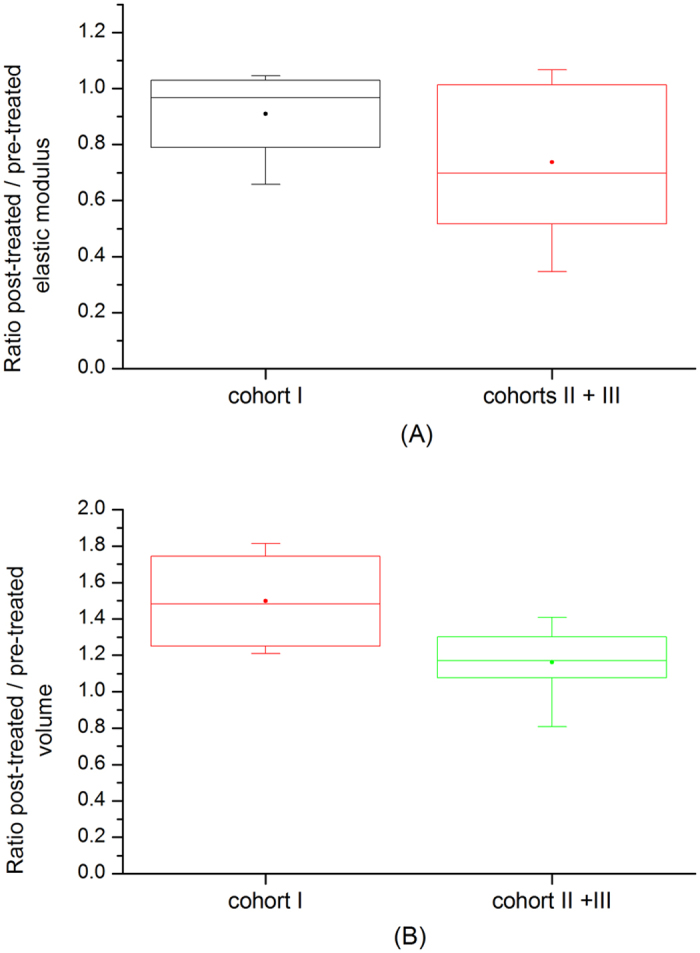
Figure 5.

Ratio of post-treatment over pre-treatment tumour volume and elastic (Young’s) modulus. First post-treatment / last pre-treatment ratio of volume (A) and elastic modulus (B) in control and drug-treated group. The box extends from the 25th to 75th percentiles with min-max whiskers; the mean values are indicated by the dots.
