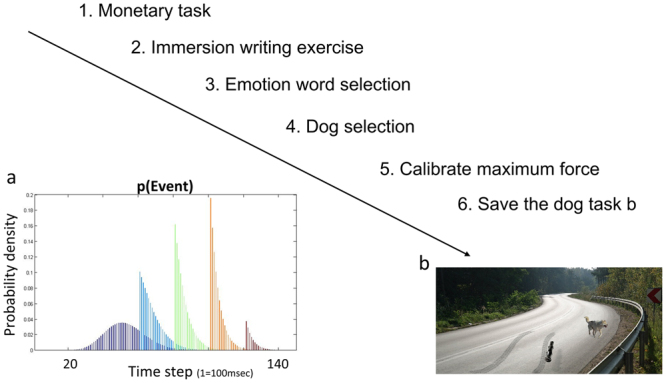
Figure 1.

Task stages. Participants first completed a practice monetary task, then an immersion exercise writing about a pet (real or hypothetical) who died, then briefly selected preferred emotional words (for use in the in-task questions), then selected a preferred dog, and finally exerted their maximum force before beginning the task (1b). How the conditional distribution of the car arriving changed with time within a trial is shown in 1a. Each trial was structured in 100 msec time steps. The distribution at 0 sec is shown in purple; this gradually changes, given that no car arrives, to the brown at t = 12 sec. (based on previous work11). For most trials, the more time had passed, the more likely it was that the car was about to arrive (blue to orange). Towards the very end of the trial, however, it became more likely that no car would appear at all. The following image used in Fig. 1b is reproduced under the terms of a Creative Commons 2.0 generic license (https://creativecommons.org/licenses/by/2.0/legalcode) and has been adapted from its original form (Original Author: Drew Avery; title: Annual Dog Sled Race). The link to the original image is: https://www.flickr.com/photos/33590535@N06/5391571785/in/photostream/ The following image used in Fig. 1b is reproduced under the terms of a Creative Commons Attribution-Share Alike 3.0 Unported license (https://creativecommons.org/licenses/by-sa/3.0/legalcode) and has been adapted from its original form (Original Author: Sebastian Hartlaub; title: Dog ultrasound whistle). The link to the original image is: https://commons.wikimedia.org/wiki/File:Hundepfeife05.JPG. The following image was reproduced under the terms of a Freeimages Content License (Author: http://www.freeimages.com/photographer/jakubson-56068). The link to the original image is: http://www.freeimages.com/photo/double-curves-1448529.
