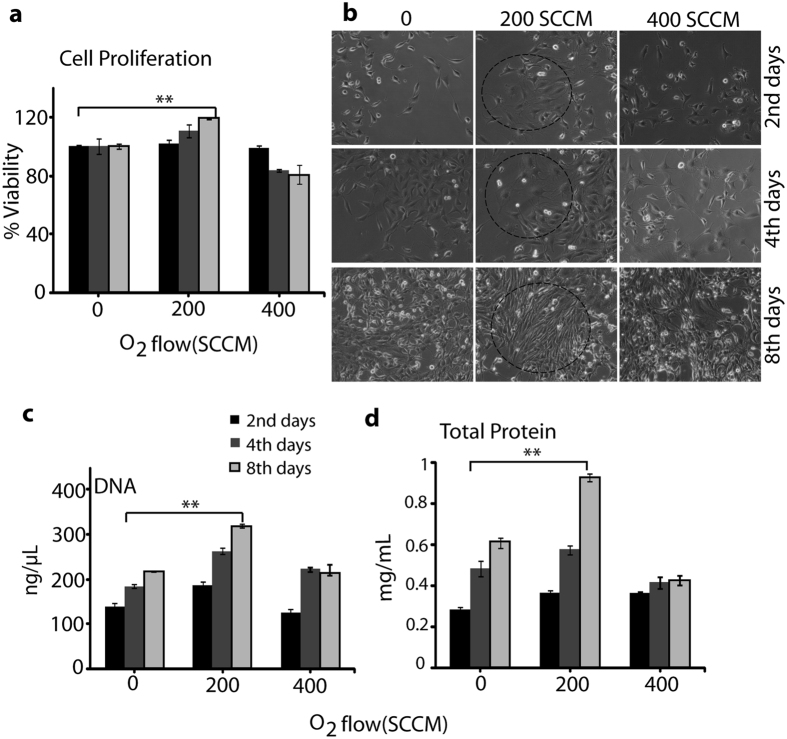
Figure 3.
L6 muscle cells proliferation, differentiation, DNA, and total protein content analysis after NO exposure. (a) Cell proliferation analysis, (b) Cell differentiation analysis using light microscopy, (c) DNA estimation, and (d) Total protein measurement after exposure with NO (200 and 400 SCCM of O2 flow rate) for 3 min day 2, day 4, and day 8. All values are expressed as ±SD in triplicate. Students t-test was performed as the control (* denotes P < 0.05 and ** denotes P < 0.01).

