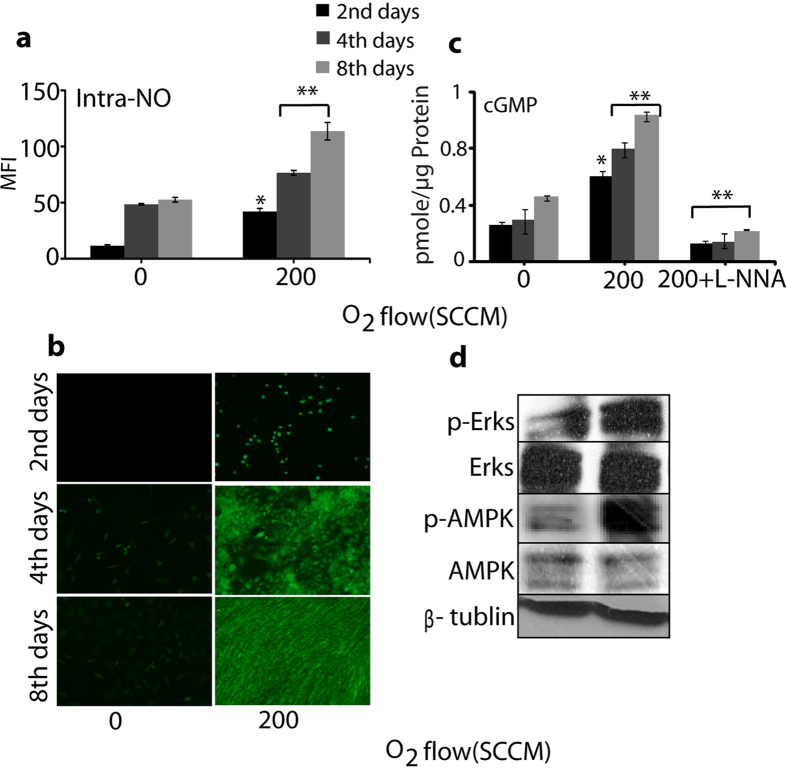
Figure 6.
Intracellular NO and oxidative markers analysis. (a) Level of intracellular NO, (b) Fluorescence image of intracellular NO (200 of O2 flow rate) for 3 min with on day 2, day 4, and day 8 (c) cGMP analysis after exposure with NO (200 of O2 flow rate) for 3 min with and without the presence of L-NNA on day 2, day 4, and day 8. Each value is the average of three technical replicates. Students t-test was performed as the control (* denotes P < 0.05 and ** denotes P < 0.01), (d) Western blot analysis of the Erks and APMK phosphorylation on 8th day after exposure with NO (200 of O2 flow rate) for 3 min. β-tublin was used as the loading control.

