Figure 4.

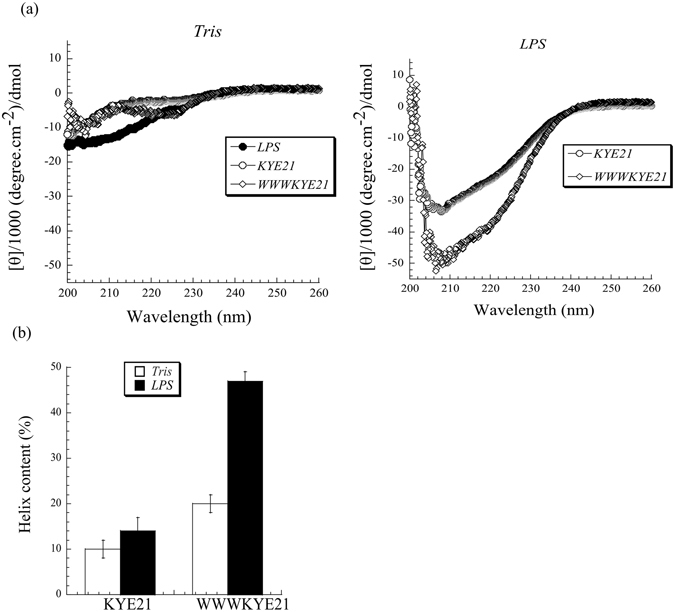
(a) CD spectra in 10 mM Tris, pH 7.4, with and without E. coli LPS. Shown also are CD spectra for LPS in 10 mM Tris, pH 7.4. (b) Helix content for the indicated peptides in buffer and in the presence of E. coli LPS (0.2 mg/ml). (n ≥ 2).

(a) CD spectra in 10 mM Tris, pH 7.4, with and without E. coli LPS. Shown also are CD spectra for LPS in 10 mM Tris, pH 7.4. (b) Helix content for the indicated peptides in buffer and in the presence of E. coli LPS (0.2 mg/ml). (n ≥ 2).