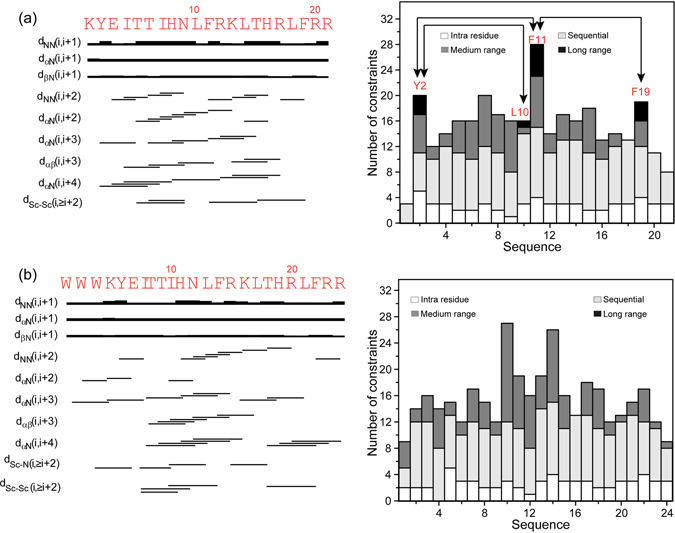
Figure 5.

Structural parameters of KYE21 and WWWKYE21 in LPS. Bar diagram (left panel) and histogram (right panel) of (a) KYE21 and (b) WWWKYE21, showing important long-range and medium-range αN (i, i + 2/i + 3/i + 4), as well as long range-NOE contacts (i, ≥i + 5) among the backbone-backbone and backbone-side chain resonances found in the trNOESY spectra, used to calculate the bound conformation of the peptides. The bar thickness in the bar diagrams corresponds directly to the NOE intensities. The primary amino acid sequences are provided at the top of the bar diagrams. The histogram depicts the number of NOE constraints used to calculate the bound conformation of the peptides as a function of residue number. The arrowheads in the histogram mark the residues that share long-range contacts with each other.
