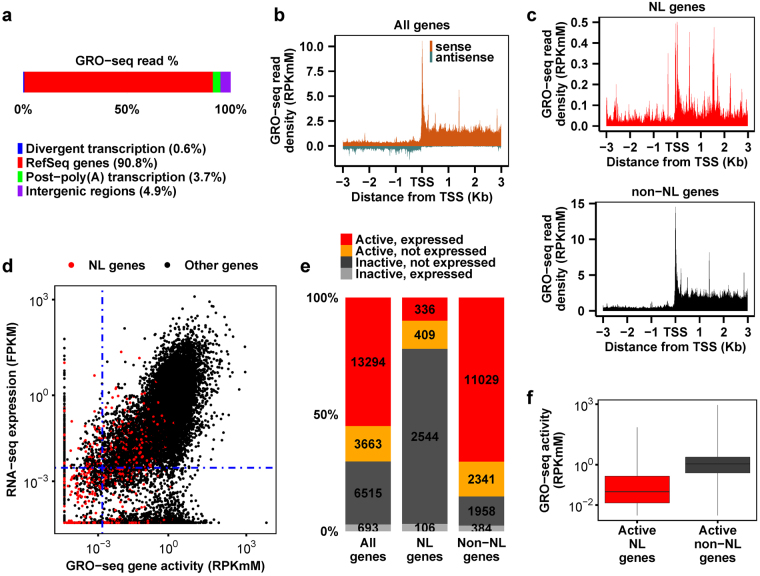
Figure 1.
Genome-wide transcriptional activities measured by GRO-seq in C2C12 myoblasts. (a) The genome-wide distribution of GRO-seq reads. In total, 122 million GRO-seq reads were obtained from two biological replicates (Spearman’s ρ = 0.75 based on reads counts in 1 kb non-overlapping contiguous windows along the genome) and pooled for analyses. Reads in the 10 kb region downstream from the annotated TES on the same strand correspond to post-poly(A) transcription (green). Reads in the 5 kb region upstream from the annotated TSS on the opposite strand correspond to divergent transcription (blue). (b,c) Average GRO-seq read density in 10 bp bins along both sense and antisense strands among all genes (b) or along sense strands among NL genes and non-NL genes, respectively (c). (d) Scatter plot of RNA-seq gene expression against GRO-seq gene activity. NL genes are shown as red dots while all other genes are shown as black dots. Spearman’s correlation coefficients between the two variables are 0.79 for all genes, 0.67 for non-NL genes and 0.56 for NL genes (p-values < 2.2e-16). Blue dashed lines indicate cut-off values for defining active genes and expressed genes, respectively. (e) Numbers and percentages of genes grouped by GRO-seq gene activity and RNA-seq expression. (f) Box plot comparing gene activities between active NL genes and active non-NL genes.

