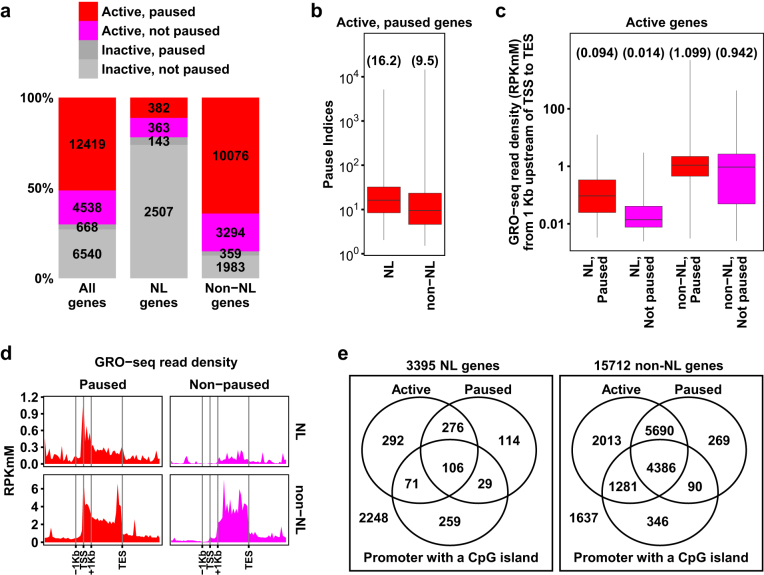
Figure 4.
Detecting RNA Pol II promoter-proximal pausing among NL genes. (a) Numbers and percentages of genes grouped by gene activity, NL-association and Pol II pausing status. (b) Box plot comparing pause indices between active, paused NL genes and active, paused non-NL genes. (c) Box plot comparing Pol II recruitment levels among active NL genes and active non-NL genes grouped by their pausing status. In panels b and c, the minimum and the maximum values are presented by whisker ends and the quartiles by box boundaries. The median values are shown in parentheses. Paused genes have significantly higher Pol II recruitment than non-paused genes among both NL and non-NL genes (Mann-Whitney test, p-values < 2.2e-16). (d) Average GRO-seq read densities along genic regions of paused and non-paused NL/non-NL genes. Data are binned as described in Fig. 3b. (e) Venn diagrams showing distributions of NL and non-NL genes according to gene activity, RNA Pol II pausing and CpG island-containing promoters. Genome coordinates of CpG islands in mouse genome assembly mm9 were downloaded from UCSC genome browser. A CpG island-containing promoter was defined by the existence of a CpG island within ±1 Kb of a TSS15.

