Figure 5.
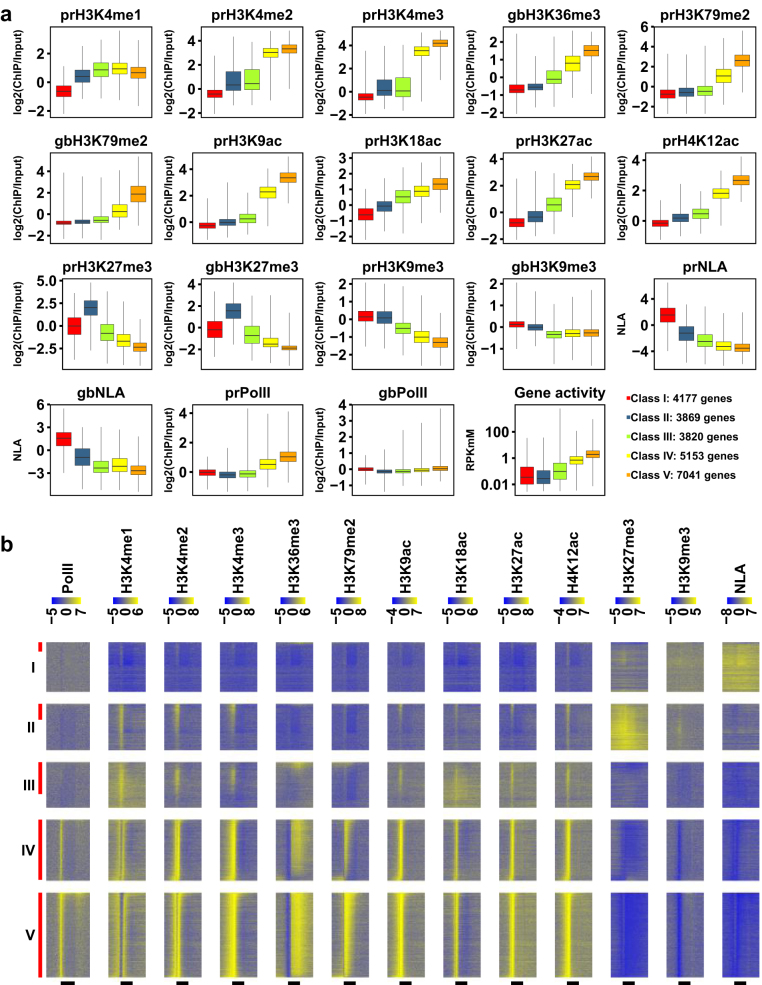
Five gene classes identified by clustering analysis exhibit distinct epigenetic features. (a) Box plots comparing levels of histone marks, NLA, and gene activity among the five gene classes in C2C12 myoblasts. “pr” and “gb” represent promoter regions and gene bodies, respectively. The minimum and the maximum values are presented by whisker ends and quartiles by box boundaries. For all variables, Mann-Whitney tests revealed significant differences (FDRs < 0.05) between every pair of the five classes. (b) Heat maps of Pol II, histone marks and NLA across genic regions. Genes in each class are sorted by decreasing gene activity. Vertical red bars on the left mark active genes (18.58%, 33.95%, 69.88%, 98.50% and 99.97% of Class I to V, respectively). Horizontal black bars at the bottom mark annotate transcribed regions from TSS to TES. Data are binned as described in Fig. 3b.

