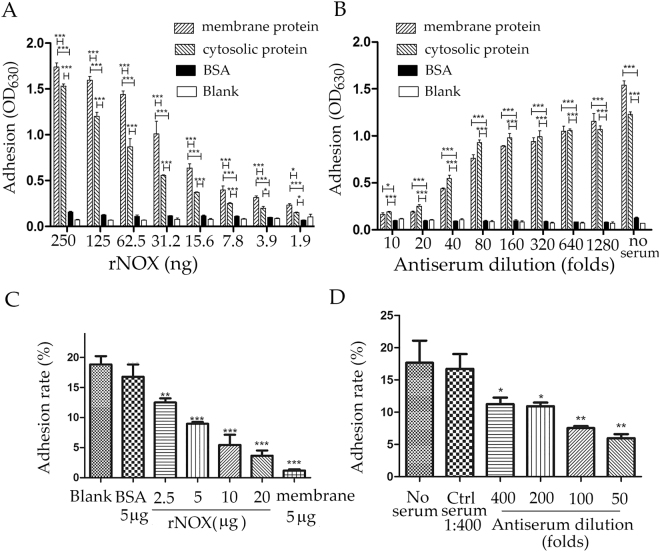
Figure 4.
rNOX adhesion and adhesive inhibition assays with ELISA and flow cytometry. (A) Adhesion of rNOX to EBL cells detected by ELISA. 0.5 μg rNOX in 100 μl PBST containing 5% BSA was serially diluted to 128-folds and 100 μl of each dilution was added into the coated wells and incubated in the plates. (B) Adhesive inhibition of rNOX to EBL cells detected by ELISA. The adhesion of 0.25 μg rNOX was inhibited by serial dilutions (from 1:10 to 1:1280) of antiserum to rNOX, and the equal amount of rNOX treatment without antiserum served as control. The wells coated with BSA (0.5 μg/well) as the negative control or non-coated well as blank control. (C) The adhesion of M. bovis to EBL cells inhibited by rNOX. The 106 EBL cells were incubated with different concentration of rNOX before infection. BSA (5 μg) in 1 ml of MEM, 5 μg of M. bovis membrane proteins in 1 ml of MEM, and 1 ml of MEM alone were used as the negative, positive, and blank controls, respectively. (D) The adhesion of M. bovis to EBL cells inhibited by anti-rNOX serum. M. bovis were incubated with anti-rNOX serum diluted from 1:50 to 1:400 before infection. The mixed negative serum (three unimmunized mice serum) was severed as negative control and 1 ml of MEM without serum (No serum) was used as the blank control. *p < 0.05, **p < 0.01, ***p < 0.001 represent statistically significant difference, and very significant difference, while “ns” represents no difference.

