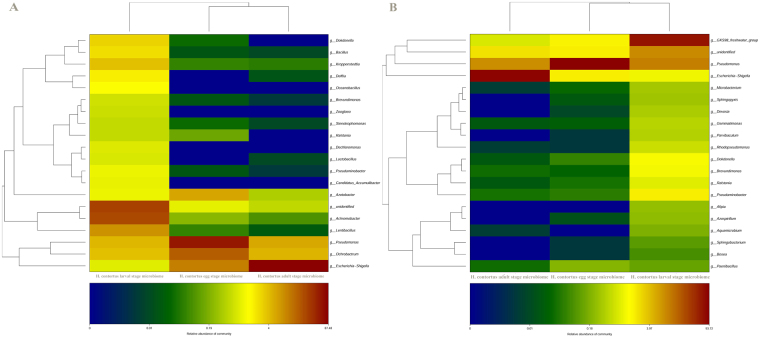
Figure 11.
Double hierarchical dendrogram of the top 50 ranked H. contortus microbiota showing the relative abundance of the bacterial community at the genus level for different life-cycle stages of H. contortus using primer pairs targetingV3–V4 (A) and V4–V5 (B) regions. The relative values for bacterial species are depicted by color intensity, with legend indicated at the bottom of the figure. Data represent average values from pooled populations (i.e. from each sheep) of eggs/larvae/adults (male and female) come from three different sheep.

