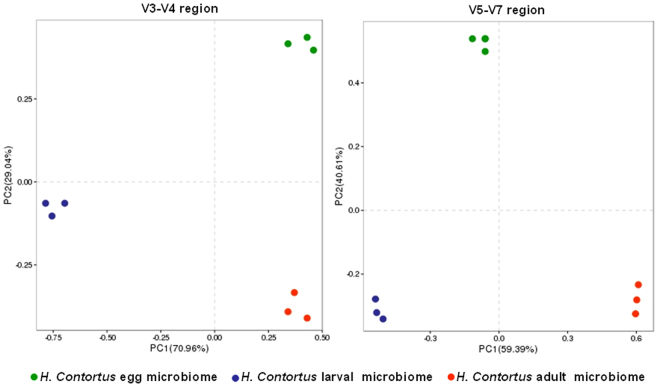
Figure 9.
Principal coordinate analysis (PCoA) of H. contortus microbiome using primer pairs targeting V3–V4 (A) and V4–V5 (B) regions. The percentage variation explained with first two principal components (PC1 and PC2). Data represent average values from pooled populations (i.e. from each sheep) of eggs/larvae/adults (male and female) come from three different sheep.

