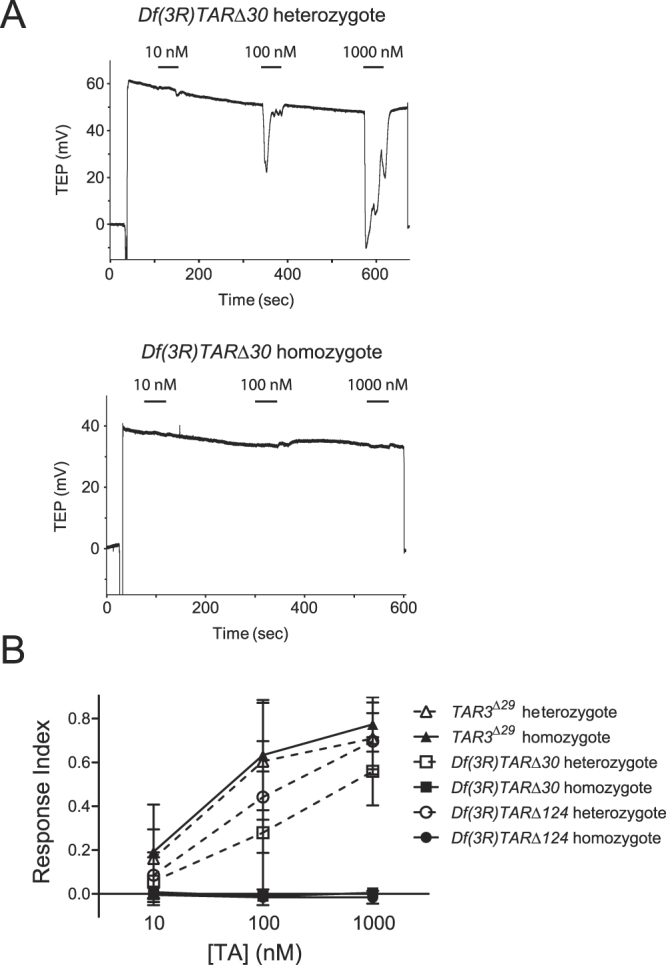
Figure 3.

Response of TAR deletion mutants to TA. (A) Representative traces showing the response to 1000 nM TA of a Df(3R)TARΔ30 heterozygote (upper trace) and homozygote (lower trace). (B) Dose-response curve to TA for TAR3 Δ29, Df(3R)TARΔ30, and Df(3R)TARΔ124 heteroyzygotes and homozygotes. The mean responses of Df(3R)TARΔ30, and Df(3R)TARΔ124 homozygotes to each concentration of TA were either not significantly different from zero by a 1-sample test or were negative. There were no differences in the responses of TAR3 Δ29 homozygotes vs heterozygotes, p > 0.05 by 2-way ANOVA and Bonferroni post-test. n = 7–12 tubules per point.
