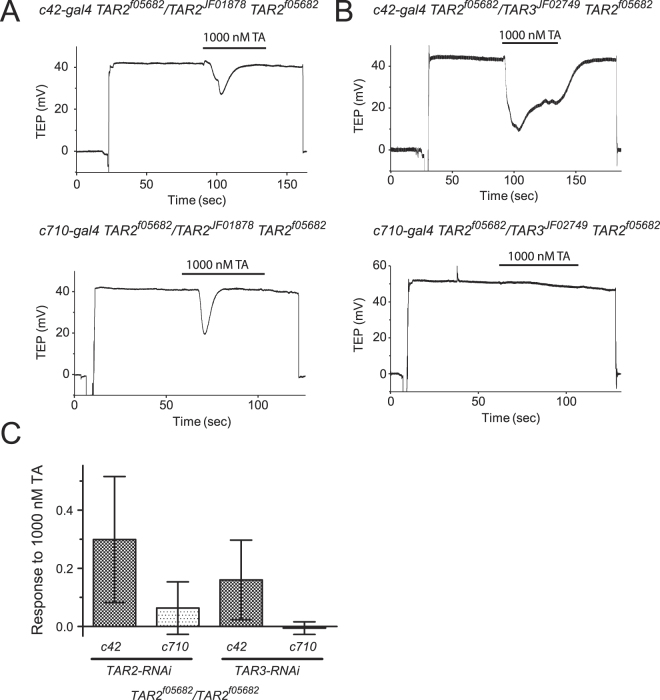
Figure 4.
Effect of RNAi against TAR2 and TAR3 on a TAR2 mutant background. (A) Representative responses to 1000 nM TA from c42-gal4 TAR2 f05682 /TAR2 JF01878 TAR2 f05682 (upper trace) and c710-gal4 TAR2 f05682 /TAR2 JF01878 TAR2 f05682 (lower trace) tubules. (B) Representative responses to 1000 nM TA from c42-gal4 TAR2 f05682 /TAR3 JF02749 TAR2 f05682 (upper trace) and c710-gal4 TAR2 f05682 /TAR3 JF02749 TAR2 f05682 (lower trace) tubules. (C) Mean responses to 1000 nM of the four genotypes shown in (A and B). Knockdown of both TAR2 and TAR3 in the stellate cells caused a significant reduction in the response compared to knockdown in principal cells, p < 0.05, 1-way ANOVA and Sidak’s multiple comparisons test, but only knockdown of TAR3 in the stellate cells resulted in a mean response that was equal to zero, p = 0.45, 1-sample t-test. n = 8–9 tubules per genotype.

