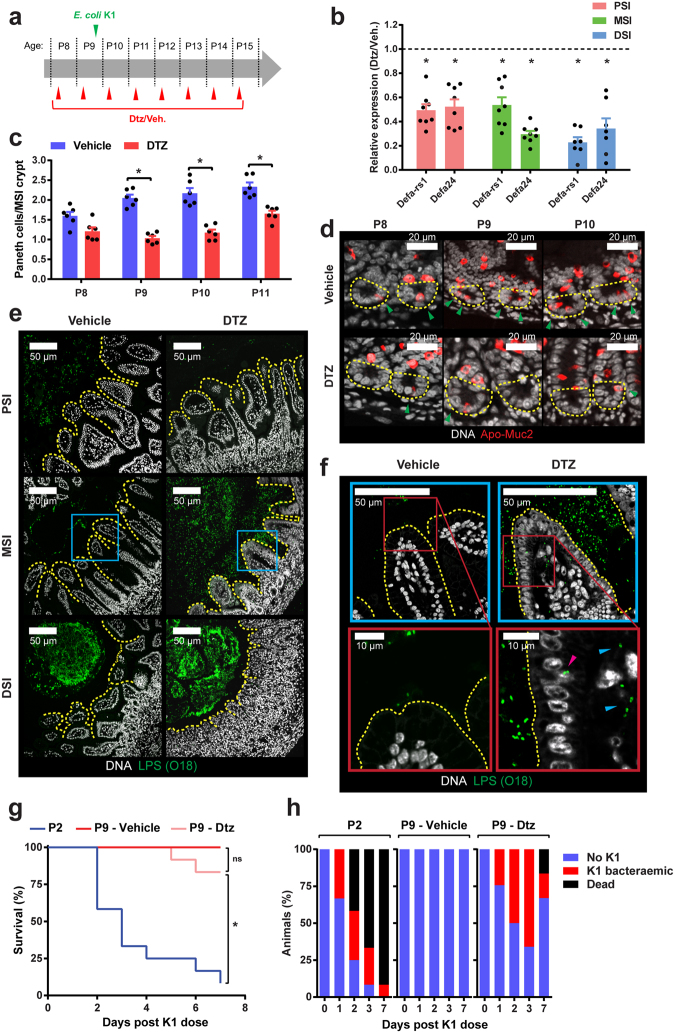
Figure 5.
DTZ-mediated suppression of Paneth cell function in infection-resistant neonatal rat pups facilitates E. coli K1 invasion of the MSI. (a) Neonatal rats received 40–50 mg/kg DTZ or Li2CO3 buffer (vehicle) by i.p. injection as indicated. Colonization with E. coli A192PP initiated at P9. (b) Determination by qRT-PCR of defa-rs1 and defa24 in PSI, MSI and DSI 72 h after initiation of DTZ dosing, relative to values obtained with corresponding tissues from animals dosed with Li2CO3 buffer alone (dashed line); n = 7–8 animals, mean ± SEM (DTZ vs. buffer), *P < 0.05 (Mann-Whitney U). (c) Quantification of Paneth cells in crypts of MSI tissues over period P8-P11. Tissues were removed from rat pups that had been dosed with DTZ or Li2CO3 buffer according to schedule A; n = 6 animals, mean ± SEM, *P < 0.05 (Sidak’s multiple comparison). (d) Representative confocal micrographs used to calculate data in C; Methacarn-fixed MSI sections were stained for Apo-Muc2 (red) and DNA (grey); Paneth cells ( ) and crypt base (yellow dashed line) indicated. (e) Confocal micrographs of Methacarn-fixed PSI, MSI and DSI sections obtained from pups dosed with DTZ or Li2CO3 buffer 48 h after initiation of colonization with E. coli A192PP at P9; sections stained for O18 LPS (green) and DNA (grey). (f) Magnification of stained MSI tissues corresponding to blue boxed regions indicated in E. Intracellular (
 ) and translocated (
 ) E. coli K1 indicated. Survival (g) and presence of E. coli K1 in blood (h) of neonatal rat pups colonized with E. coli A192PP. Pups (n = 12 animals for each group) were fed bacteria at P9 and dosed with DTZ or Li2CO3 buffer according to the dosing schedule (a). Response of P2 pups to colonization (no DTZ) is also shown.

