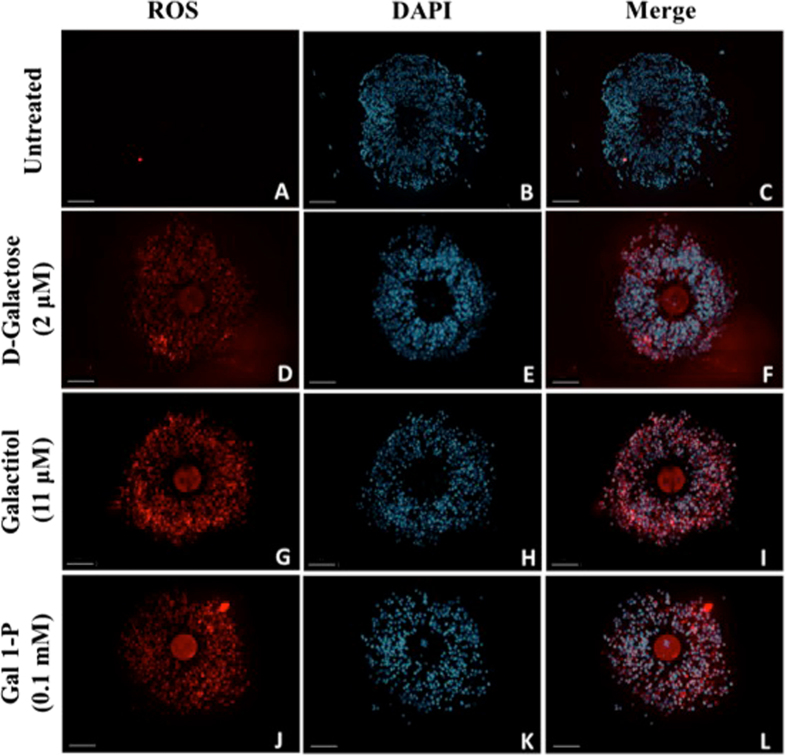
Figure 6.
Evaluation of ROS generation. Images (A–L) represent images of intracellular ROS generation, 4′,6-diamidino-2-phenylindole (DAPI) fluorescence and merged images of ROS generation and DAPI of cumulus oocyte complex exposed to D-galactose (Images D–F), galactitol (Images G–I), and Gal 1-P (galactose 1-phosphate) (Images J–L), and untreated control (Images A–C). Scale bars: 100 μm. Images shown are from a typical experiment performed at least three times.

