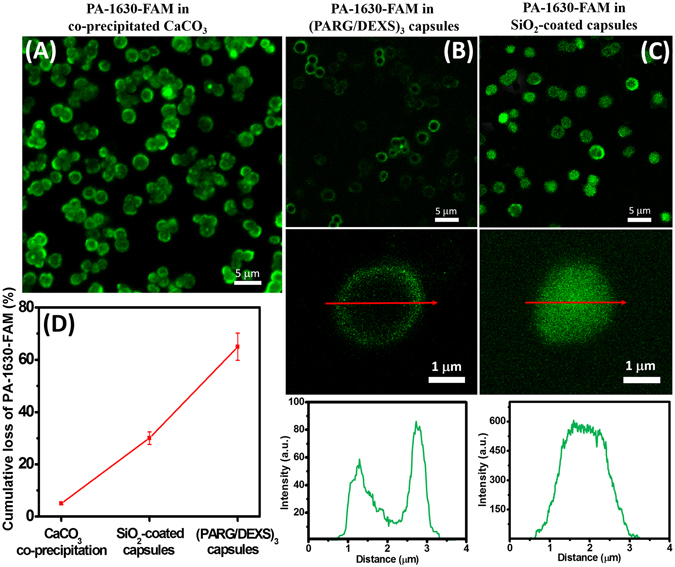
Figure 3.

Confocal microscopy analysis of distribution of PA-1630-FAM in used carriers: (A) CaCO3 microparticles; (B) (PARG/DEXS)3 capsules; (C) SiO2-coated capsules. The plots below CLSM images are the representative fluorescence intensity profiles over the microcapsule. (D) Cumulative loss of PA-1630-FAM after dissolution of CaCO3 in SiO2-coated and (PARG/DEXS)3 capsules, respectively.
