Figure 6.

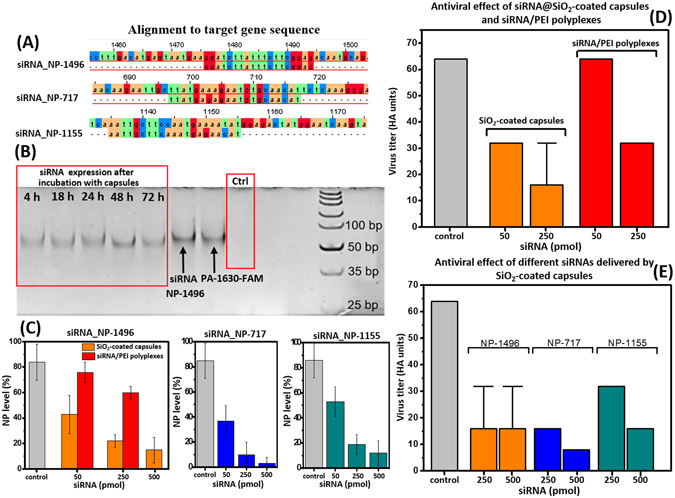
(A) Schematic diagrams showing the location of each siRNA in the viral genome. (B) Results of electrophoresis of the NP-1496 siRNA PCR products extracted from MDCK cells. (C) ELISA analysis showing the reduction of viral NP level in infected A549 cells treated with different anti-viral siRNAs in encapsulated form (50 pmol–1 capsule/cell; 250 pmol–5 capsules/cell; 500 pmol–10 capsules/cell). (D) Comparison of antiviral effect of NP-1496 siRNA delivered by siRNA/PEI polyplexes and SiO2-coated capsules (50 pmol–1 capsule/cell; 250 pmol–5 capsules/cell; 500 pmol–10 capsules/cell). (E) Inhibition of influenza virus production by different dose of siRNAs in encapsulated form. Viral titers was measured 72 h after infection in a hemagglutination assay. The data are presented as means ± standard deviation (SD) from three independent experiments. Note that some hemagglutination unit values were identical for the triplicate experiments, and so standard deviation values are 0.
