
Figure 3.
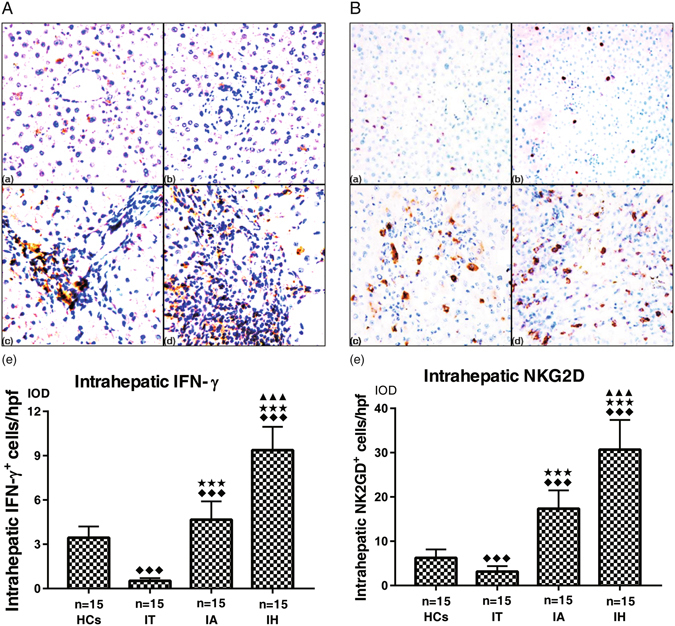
Representative graphs of intrahepatic IFN-γ+ cells (A, 200×) and NKG2D+ cells (B, 200×) expressions. (a) HCs, healthy controls, (b) IT, chronic HBV carriers, (c) IA, CHB patients, (d) IH, HBV-ACLF patients. (e) Collective analysis of results from all 4 groups. IFN-γ+ cells were distributed mainly in the inflammatory sites and periportal areas that were infiltrated with lymphocytes. NKG2D+ cells were mainly distributed in Disse’s space of hepatic lobule in HCs and chronic HBV carriers, and mainly in periportal areas in CHB and HBV-ACLF group. Nemenyi test following Kruskal-Wallis H test were used for comparing intrahepatic IFN-γ+ and NKG2D+ cells expressions between two groups. Compared with HCs group, ◆◆◆ P < 0.01; Compared with IT group, ★★★ P < 0.01; Compared with IA group, ▲▲▲ P < 0.01.