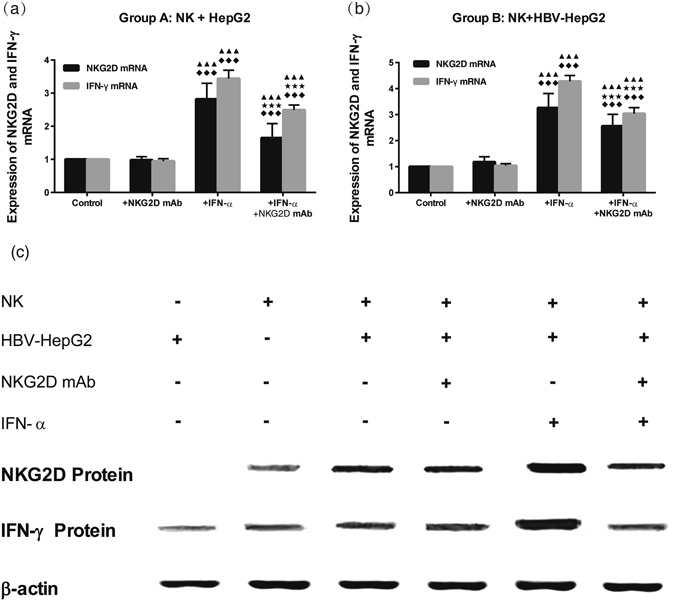
Figure 4.

Analysis of NKG2D and IFN-γ mRNA levels in co-cultured cells (NK + HepG2/HBV-HepG2) of Group A (a, NK + HepG2) and Group B (b, NK + HBV-HepG2). Nemenyi test following Kruskal-Wallis H test were used for comparing mRNA expressions of NKG2D and IFN-γ between two compared groups. Compared with Control group (NK + HepG2 or NK + HBV-HepG2), ◆◆◆ P < 0.01; Compared with Control + NKG2D mAb group, ★★★ P < 0.01; Compared with Control + IFN-α group, ▲▲▲ P < 0.01; Analysis of the levels of NKG2D and IFN-γ protein in different groups (c). The density of NKG2D and IFN-γ protein was the highest in group of NK + HBV-HepG2 + IFN-α, followed by group of NK + HBV-HepG2 + IFN-α + NKG2DmAb and group of NK + HBV-HepG2 + NKG2DmAb.
