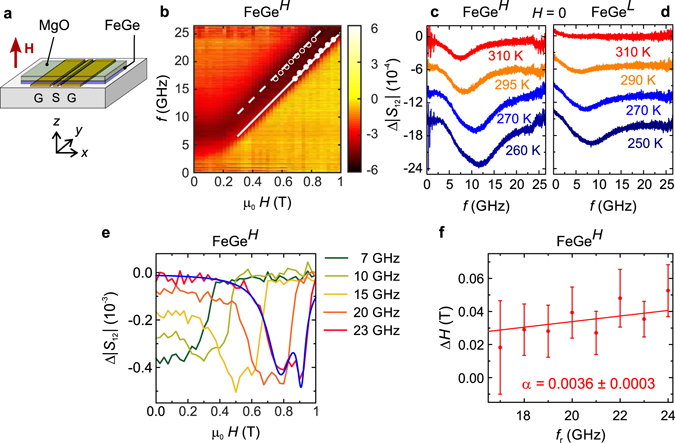
Figure 3.

Broadband spectroscopy data. (a) The FeGe thin film sample is placed top-down onto the CPW consisting of a signal (S) and two ground (G) lines. The static field H is applied perpendicular to the thin film and the rf current applied to the conduction lines produces an rf field h x along x. (b) Colour-coded microwave absorption Δ|S 12| spectra at different magnetic fields recorded at 310 K on a FeGeH sample. Darker regions correspond to stronger absorption. The dashed and solid lines correspond to a fit to PSSW modes, see text. Dots show fitted resonances (the error margin corresponds to the symbol size). (c,d) Zero-field absorption spectra at different temperatures recorded on a FeGeH and FeGeL sample, respectively. For the latter, no resonance is resolved above 290 K. Spectra are offset for clarity. The increased noise for f < 2.5 GHz and f > 22 GHz is attributed to the transmission properties of the microwave antenna. (e) Spectra at constant frequency, as a function of applied field at 310 K and exemplary fit of the sum of two Lorentzians (blue) to the 23 GHz data. (f) Field linewidth of the high-field mode (solid line in b) with linear fit for determining the intrinsic damping parameter α intr.
