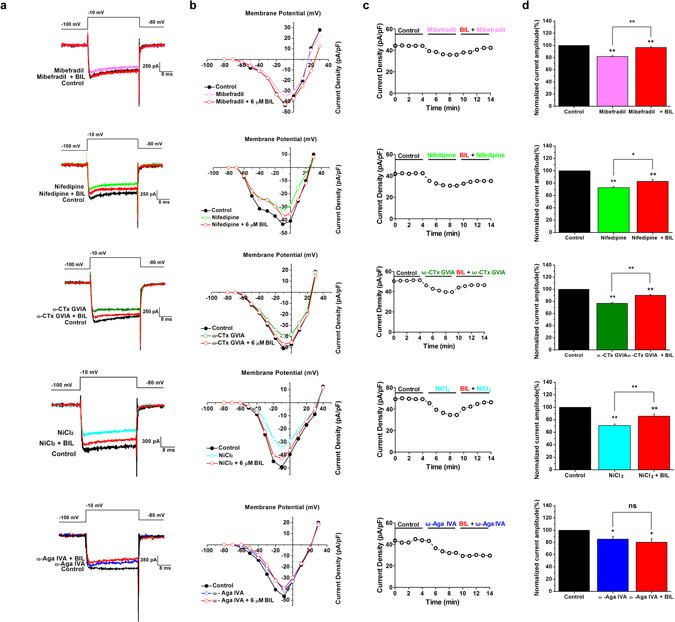
Figure 4.

Pharmacological isolation of the VGCC current component enhanced by bilirubin. (a) Example traces are shown in control (black traces), during application of 1 µM Mibefradil (top panel, magenta trace, n = 7), 10 µM Nifedipine (2nd panel, green trace, n = 7), 1 µM ω-CTx GVIA (3rd panel, olive trace, n = 7), 50 µM NiCl2 (4th panel, cyan trace, n = 7), or 500 nM ω- Agatoxin IVA (bottom panel, blue trace, n = 7), respectively, and subsequent application of 6 µM Bilirubin (red traces), elicited by step depolarizations to −10 mV from a hyperpolarizing potential of −100 mV. (b) Current-voltage relationships from data in A measured at the peak current density showed calcium currents in control (black traces), Mibefradil (top panel, magenta trace), Nifedipine (2nd panel, green trace), ω-CTx GVIA (3rd panel, olive trace), NiCl2 (4th panel, cyan trace), or ω- Agatoxin IVA (bottom panel, blue trace), respectively, and further addition of 6 µM bilirubin (red traces). (c) Time course of the effect of control condition, each antagonist and co-application of bilirubin. The calcium current density is plotted against time. (d) The normalized VGCC current amplitude before (black bars), during application of Mibefradil (top panel, magenta bar), Nifedipine (2nd panel, green bar), ω-CTx GVIA (3rd panel, olive bar), NiCl2 (4th panel, cyan bar), or ω- Agatoxin IVA (bottom panel, blue bar), respectively, and combined application of 6 μM bilirubin (red bars). Charge carrier: 5 mM Ba2+. *P < 0.05, **P < 0.01, ns, not significant, one-way ANOVA with Bonferroni post hoc test.
