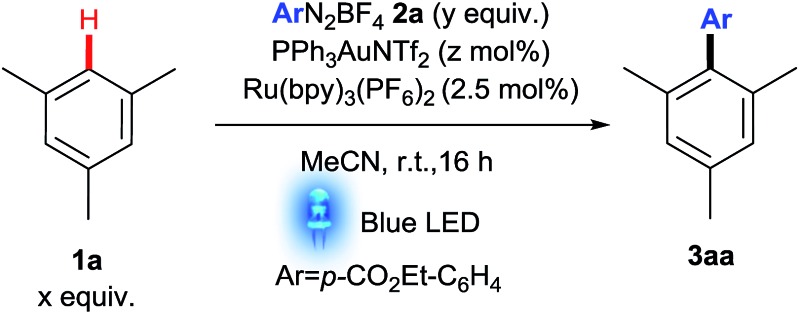
Table 1. Selected optimisation reactions.

| |||||
| Entry a | x | y | z | Modification | Yield b (%) |
| 1 | 1 | 2 | 5 | — | 31 |
| 2 | 1 | 1 | 5 | — | 51 |
| 3 | 3 | 1 | 5 | — | 67 |
| 4 | 10 | 1 | 5 | — | 54 |
| 5 | 3 | 1 | 5 | Eosin Y instead of [Ru] | 62 |
| 6 | 3 | 1 | 5 | Fluorescein instead of [Ru] | 58 |
| 7 | 3 | 1 | 10 | — | 81 |
aDegassed MeCN.
bDetermined by 1H NMR analysis using dimethylsulfone as internal standard.
