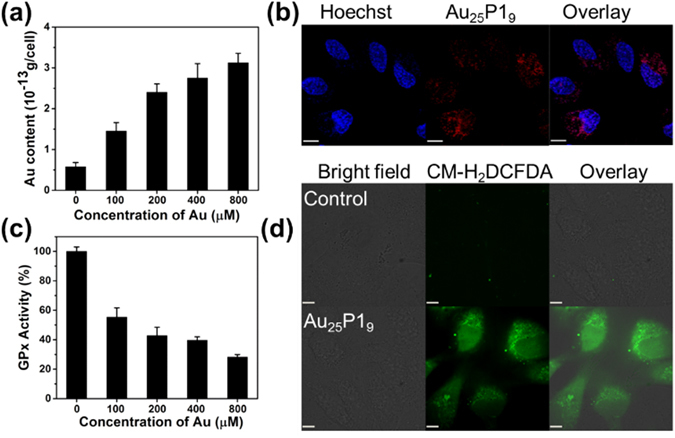
Figure 3.

(a) Quantification of Au25P19 uptake by A549 cells (b) CLSM images of A549 cells treated with 800 µM of Au25P19 for 48 h and the cell nuclei were stained with Hoechst 33342. (c) GPx-1 activity suppressed by Au25P19 in a dose dependent manner in A549 cells. (d) CLSM images of cellular ROS level of A549 cells treated with Au25P19 for 48 h, Scale bar is ~11 µm.
