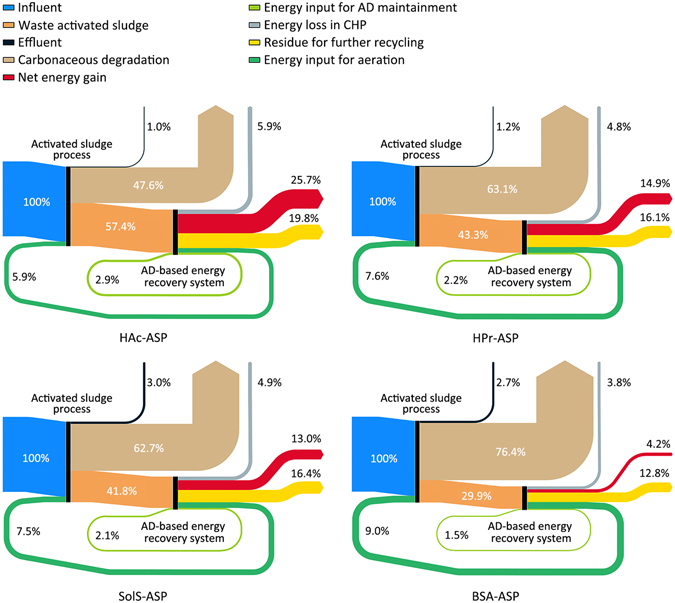
Figure 2.

Quantitative visualized diagram tracing the embodied and recovered energy flow within each ASP system, through activated sludge treatment, and energy recovery and reuse processes, to the delivery of net energy gain for further end use. The energy potential of 0.772 kWh contained in the coming waste stream (200 g COD/m3) was used as benchmark (blue sky) for quantitative visualization.
