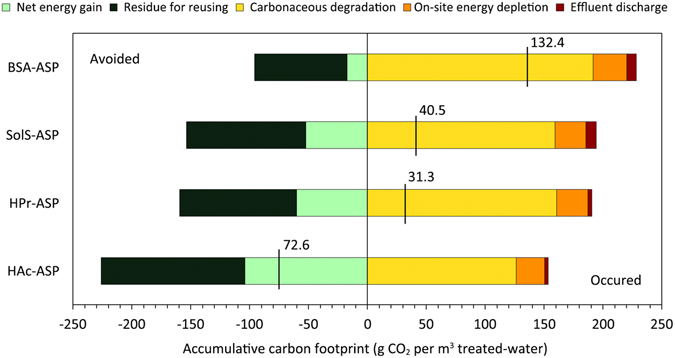
Figure 3.

Accumulative carbon footprint for integrating wastewater treatment with expanded energy capture in all four ASPs. The green color series indicate the carbon emission avoided from bioenergy production, while the orange color series represent the carbon emission that occurred, including carbonaceous degradation in the ASPs, energy depletion for system maintenance, and also effluent discharge. Note that the black vertical segment presents the net carbon emission of the system boundary considered in each ASP.
