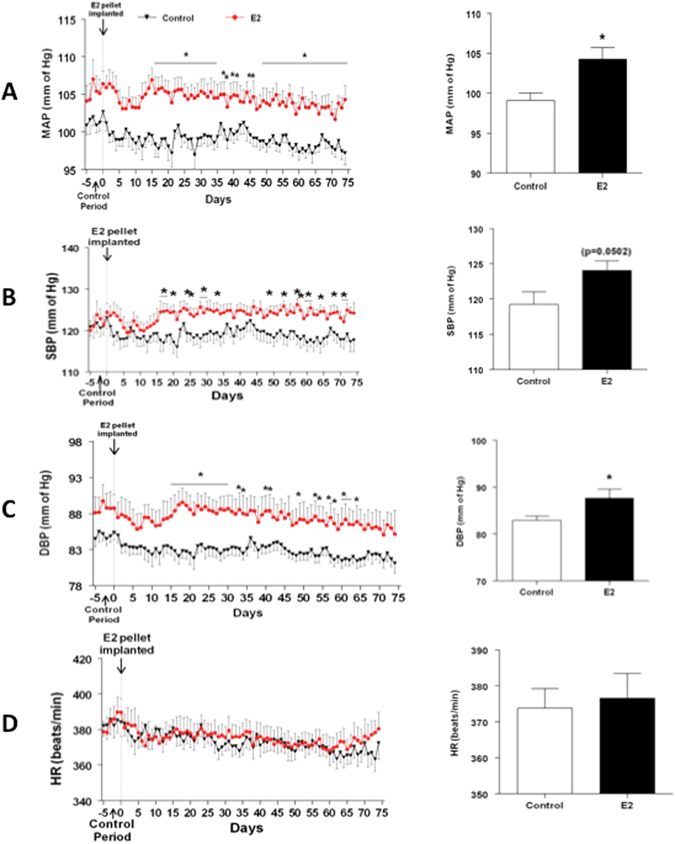
Figure 2.

Time course for chronic E2 exposure-induced changes in blood pressure parameters. Line graphs depicting mean arterial pressure (MAP; mmHg) (A), systolic blood pressure (SBP) (B), diastolic blood pressure (DBP; mmHg) (C) and heart rate (HR; beats/min) (D): closed red circles represent E2 pellet implanted (20 ng/day, 90-day slow-release pellets) and closed black triangles represent control rats (n = 7–8/group). Panels on the right: Bar graphs showing the average values of the cardiovascular parameters over the entire observation period. *Denotes significant difference (p < 0.05) from control rats.
