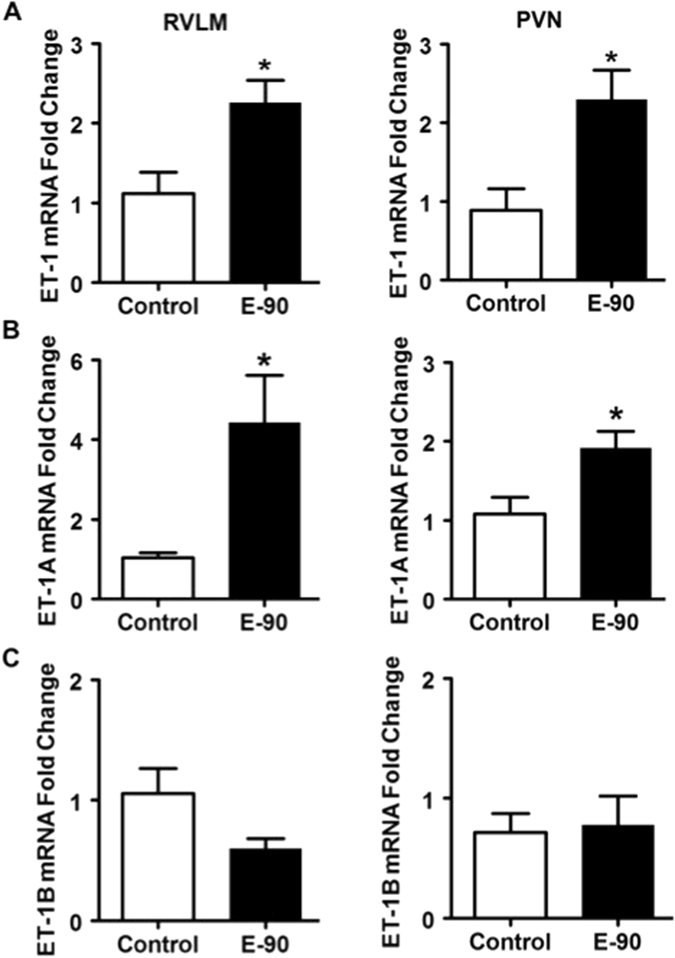
Figure 3.

Effect of chronic E2 exposure on the gene expression of ET-1 and its receptors in the RVLM and PVN. The mRNA expression levels of ET-1, ETA and ETB receptor and Angiotensin II type 1 receptor in the RVLM and PVN of control and E2 treated rats are shown in (A–H). The fold change was calculated relative to β-actin by the comparative Ct method using 2−ΔΔCt. The Ct values of all the groups were normalized to control rats (n = 4–5 per group). *Denotes significant difference (p < 0.05) from control group.
