
Figure 4.
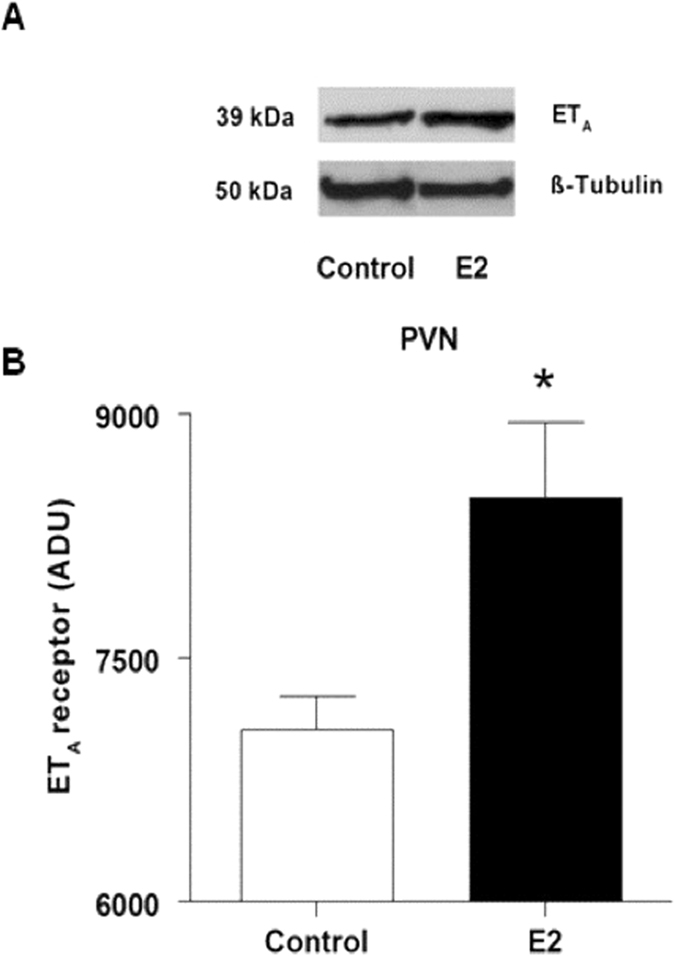
Effect of chronic E2 exposure on protein levels of ETA in the PVN. Sample blots and densitometry results from western blot analysis of ETA in the PVN of control and E2-treated rats are shown. Bar graphs represent mean ± SE for 4–5 animals. *Indicates significant difference from control animals.