Figure 3.

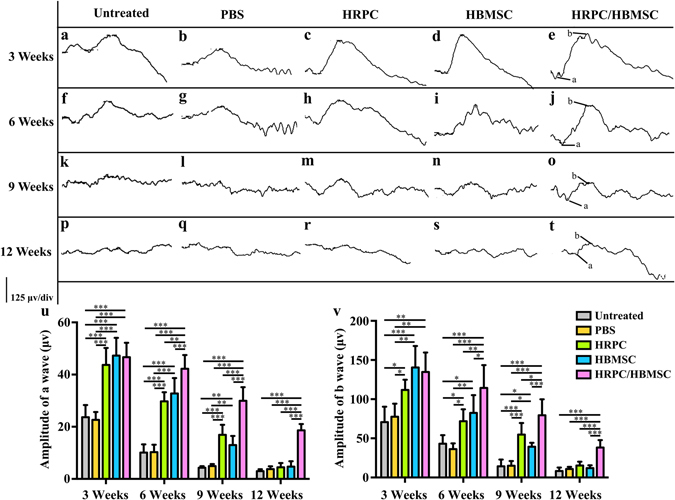
Comparison of electroretinograms (ERG) test after single and combined cell transplantation into subretinal space (SRS). (a,f,k,p) Representative ERG test of untreated RCS rats on 3, 6, 9 and 12 weeks (the same time point with operational groups). (b,g,l,q) Representative ERG test after PBS injection on 3, 6, 9 and 12 post operational weeks. (c,h,m,r) Representative ERG test after human retinal progenitor cells (HRPCs) injection on 3, 6, 9 and 12 post operational weeks. (d,i,n,s) Representative ERG test after human bone mesenchymal stem cells (HBMSCs) injection on 3, 6, 9 and 12 post operational weeks. (e,j,o,t) Representative ERG test after HRPCs and HBMSCs double injection on 3, 6, 9 and 12 post operational weeks. (u) Statistical analysis of the amplitude of ERG a wave in all 5 groups at 4 time points. (v) Statistical analysis of the amplitude of ERG b wave in all 5 groups at 4 time points. Results showed that all cell transplantation groups displayed increases of the ERG amplitude. Combined transplantation showed longest vision-functional rescue effect. *P < 0.05; **P < 0.01; ***P < 0.001. (n = 3).
