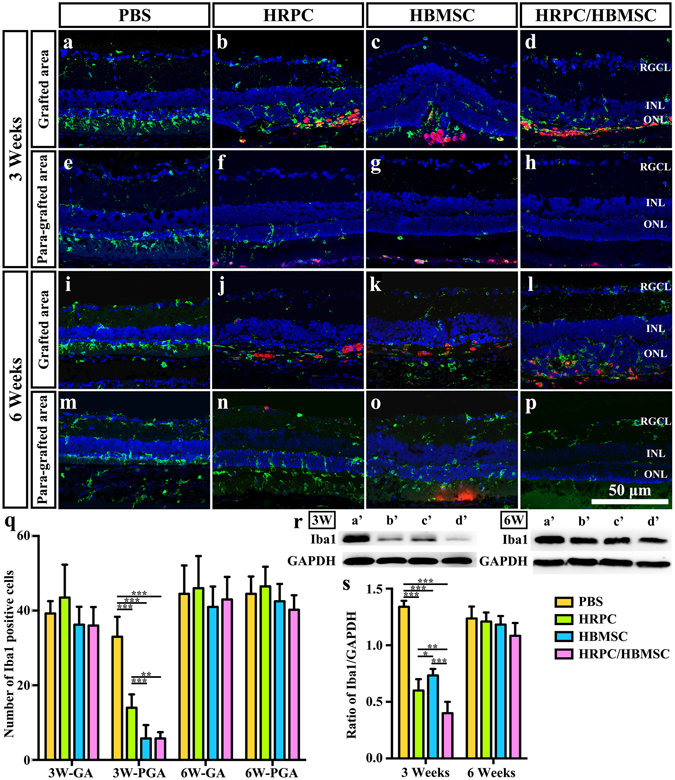
Figure 7.

Comparison of microglia activation after single and combined cell transplantation into subretinal space (SRS). (a–d) Representative image of Iba1-staining microglia within grafted area after PBS, human retinal progenitor cells (HRPCs), human bone mesenchymal stem cells (HBMSCs) and combined cells injection on 3 post operational weeks. (e–h) Representative image of Iba1-staining microglia within para-grafted area after PBS, HRPCs, HBMSCs and combined cells injection on 6 post operational weeks. (i–l) Representative image of Iba1-staining microglia within grafted area after PBS, HRPCs, HBMSCs and combined cells injection on 3 post operational weeks. (m–p) Representative image of Iba1-staining microglia within para-grafted area after PBS, HRPCs, HBMSCs and combined cells injection on 6 post operational weeks. (q) Corresponding statistical analysis of (a–p). GA: grafted area. PGA: Para-grafted area. (r) Western blot analysis of Iba1 protein on post operational 3 and 6 weeks (a’: PBS; b’: HRPCs; c’: HBMSCs; d’: HRPCs/HBMSCs). For original uncropped images, please see Supplementary Figs 2 and 3. (s) Corresponding statistical analysis of (r). *P < 0.05; **P < 0.01; ***P < 0.001. (n = 3).
