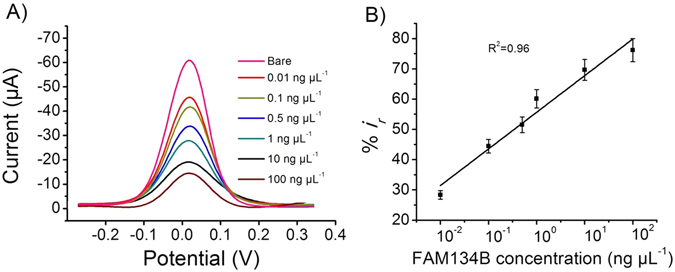
Figure 4.

Assay performance. (A) Change of the DPV responses at the immunosensing surface after incubation with designated concentrations of FAM134B protein. (B) Corresponding relative current change-concentration curve. Each data point represents the average of the three separate trials (n = 3) and error bars represents the standard deviation of measurements within experiments.
