Figure 5.
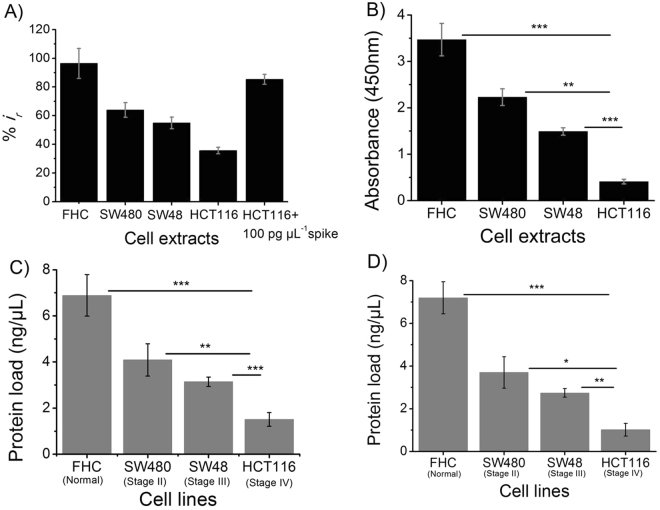
Profiling of FAM134B expression in cancer cell lines. Comparison of relative (A) current change and (B) absorbance response obtained for 7 µL of FHC, SW480, SW48, and HCT116 cell extracts. The relative current change obtained for the 7 µL HCT116 cell extract spiked with 100 pg µL−1 FAM134B protein is also included in (A). FAM134B protein concentrations (in ng μL−1) in FHC, SW480, SW48, and HCT116 cell extracts were measured using the standard curves obtained from (C) electrochemical and (D) ELISA measurements (see Figs 4 and S5B). Each data point represents the average of the three separate trials (n = 3) and error bars represents the standard deviation of measurements within experiments. Statistical significance were determined by pairwise comparison between two experimental groups using student's t-test *p < 0.05, **p < 0.01 and ***p < 0.001 when compared among/between the experimental groups.

