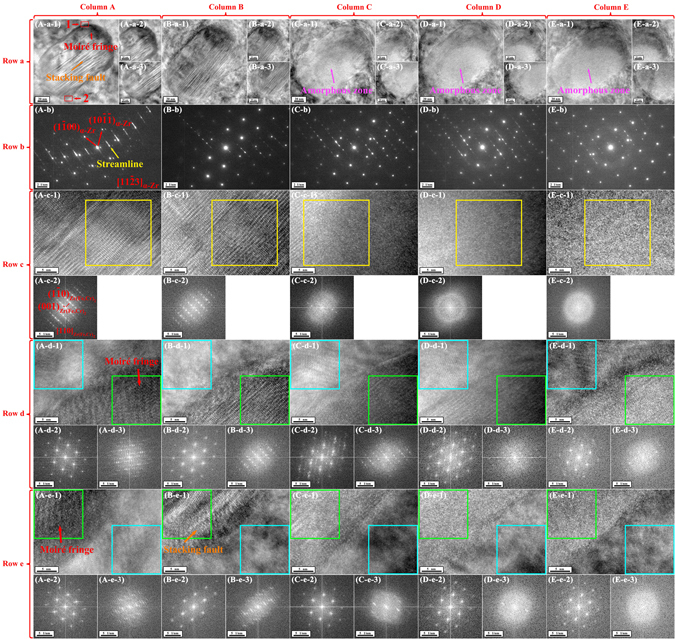
Figure 3.

TEM observations of the precipitate of interest and its surrounding α-Zr matrix before and after irradiation at room temperature with focused and stationary electron beam at an incident energy of 30 keV in the FE-SEM viewed along the [113]α-Zr direction. Column A–E of Fig. 3 shows TEM results before and after irradiation for 32, 64, 96, and 128 electron beam scans, respectively. Row a of Fig. 3 shows BF TEM images of the precipitate of interest and its surrounding α-Zr matrix. Row b of Fig. 3 shows composite SAED patterns of the precipitate of interest and its surrounding α-Zr matrix. Row c–e of Fig. 3 show HRTEM images and their corresponding FFT diffraction patterns corresponding to the center (not the same position), the up-left corner (Area 1 in Fig. 3(A-a-1)) and the down-right corner (Area 2 in Fig. 3(A-a-1)) of the precipitate of interest, respectively. In Row c of Fig. 3, the FFT diffraction pattern in every column corresponds to the area outlined by a yellow square in the corresponding HRTEM image. In Row d and e of Fig. 3, the left and right FFT diffraction patterns in every column of Fig. 3 correspond to the areas outlined by blue and green squares in the corresponding HRTEM image, respectively.
