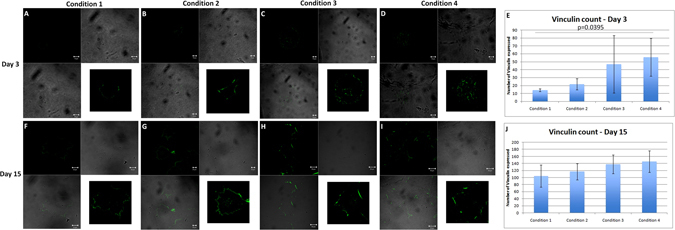
Figure 6.

Expression of Vinculin as a focal adhesion marker. (A–D) Number of focal adhesions found in C4 was statistically higher compared to C1 (p = 0.0395). C3 also showed high number of focal adhesion points but was not significant at day 3. Scale bar = 10 µm. This highlights that mechanical and molecular forces may induce higher focal adhesions and integrins for better cell attachment. (F–I) At day 15, Vinculin was expressed in all the conditions without any significant difference. (E) Graphical representation of number of focal adhesions that expressed per cell on day 3 and (J) on day 15. Scale bar for C1 and C2 = 20 µm; C3 and C4 = 50 µm. Image inserts show a higher magnification of the analyzed cell with the expression of Vinculin.
