
Figure 4.
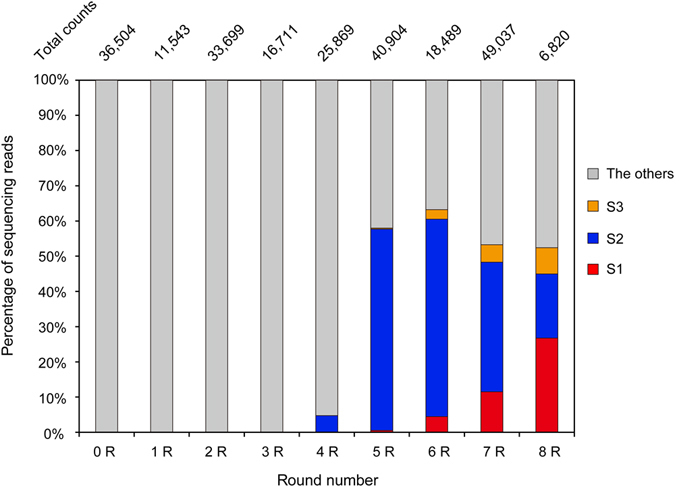
The fraction of S1, S2, and S3 in the sequencing reads from 0–8R RNA pools from SELEX. Total counts are the numbers of total reads obtained by HTS. S1, S2, S3, and others are shown in red, blue, orange, and gray bars, respectively.
Official websites use .gov
A
.gov website belongs to an official
government organization in the United States.
Secure .gov websites use HTTPS
A lock (
) or https:// means you've safely
connected to the .gov website. Share sensitive
information only on official, secure websites.
The fraction of S1, S2, and S3 in the sequencing reads from 0–8R RNA pools from SELEX. Total counts are the numbers of total reads obtained by HTS. S1, S2, S3, and others are shown in red, blue, orange, and gray bars, respectively.