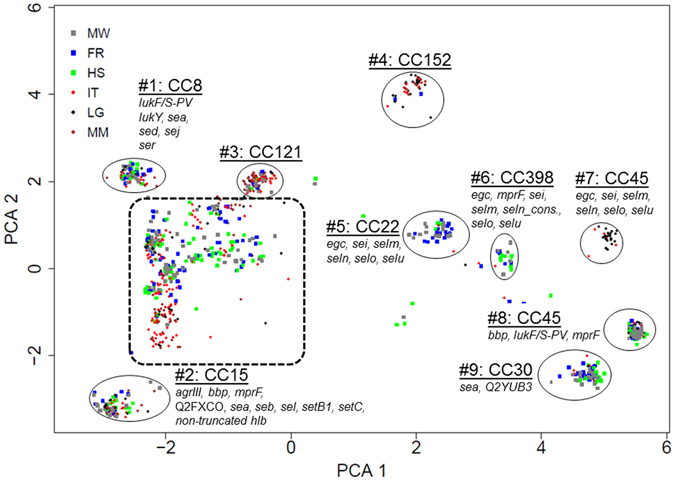
Figure 2.

Characteristic genotypic patterns of isolate subgroups detected by DNA microarray. The cluster analysis of 1200 S. aureus isolates was performed using the principal component analysis (PCA). Each dot represents one isolate. Dots are colour coded according to the study sites in Africa (Ifakara, Tanzania (IT), Lambarene, Gabon (LG), Manhiça, Mozambique (MM)) and Germany (Münster (MW), Freiburg (FR), Homburg (HS)). Major clusters that correspond to multilocus sequence typing clonal complexes (CC) are highlighted. Genes that were significantly (p < 0.01) associated with the respective CC are mentioned. Virulence factors that were significantly associated with ≥4 CCs are not displayed. Isolates encircled with a dashed line belong to CC1, CC5, CC6, CC7, CC9, CC12, CC20, CC25, CC49, CC50, CC59, CC80, CC88, CC97, CC101, CC188, CC395, CC509, CC707, CC913, CC1021, CC1290 or ST580, ST1093, ST2370, ST2733, ST2734, ST2735, ST2744, and ST2678.
