
Figure 4.
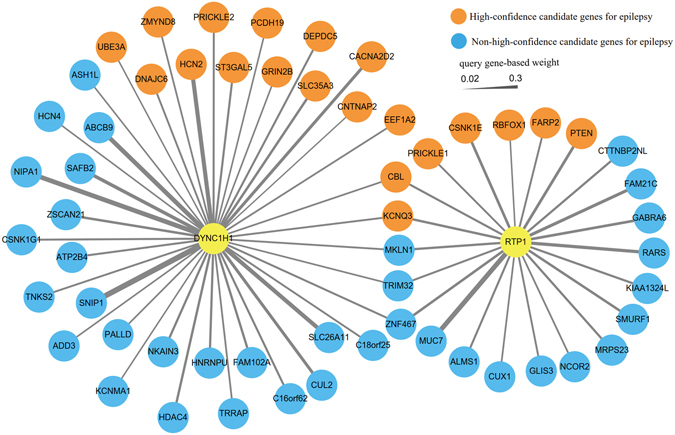
Genetic interaction network analysis of DYNC1H1 and RTP1. A node represents genes, and an edge represents interactions between each pair of genes. Candidate epilepsy genes were extracted from the EpilepsyGene database.
Official websites use .gov
A
.gov website belongs to an official
government organization in the United States.
Secure .gov websites use HTTPS
A lock (
) or https:// means you've safely
connected to the .gov website. Share sensitive
information only on official, secure websites.
Genetic interaction network analysis of DYNC1H1 and RTP1. A node represents genes, and an edge represents interactions between each pair of genes. Candidate epilepsy genes were extracted from the EpilepsyGene database.