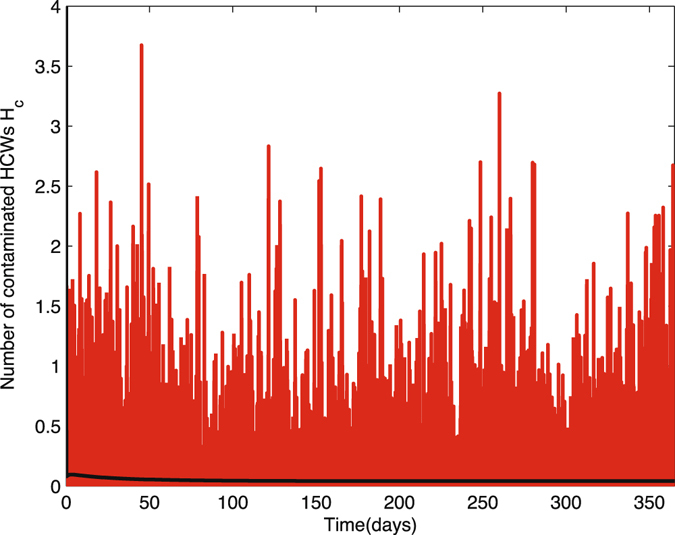
Figure 11.

Ten sample paths of the number of contaminated HCWs in nosocomial infection model with environment infection are graphed with the deterministic solution (black curve). The parameter values are Δt = 0.01, N p = 23, N h = 23, θ = 0.067, α p = 0.0435, β p = 0.72, β h = 0.20, η = 0.4, γ u = 0.067, γ c = 0.046, γ b = 0.7, k p = 0.000004, k h = 0.00001, (1 − η) = 0.6, μ c = 24, v p = 235, v h = 235, time = 365,
