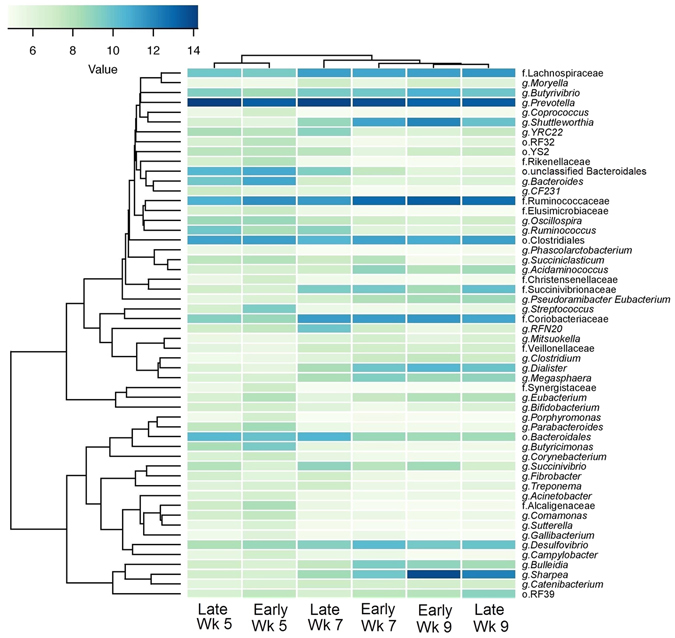
Figure 3.

Correlation between ruminal microbiota and calf age and weaning strategy. The heatmap shows bacterial abundance in rumen varied with calf age (5, 7 and 9 weeks) and weaning age (6 vs. 8 weeks for early- and late-weaning, respectively). Data represent taxa present at greater than 1% of community that were significantly different (P < 0.05) between at least two ages or between treatment groups (weaning age). See Table S1 for additional data. The OTU count data was subjected to variance stabilizing transformation and summarised to calculate genus abundant data. Hierarchically clustering was then performed based on complete linkage of Euclidean distances matrix and visualized over heatmap using the heatmap.2 function of the “gplots” R package.
