
Figure 5.
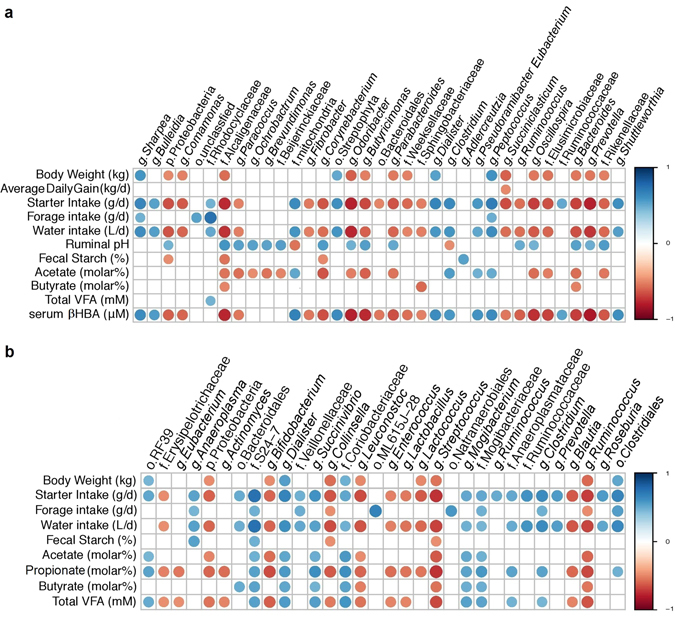
Correlations between production variables and relative taxa abundance. Spearman non-parametric rank correlation matrix of the dominant bacterial genera across (a) rumen and (b) faecal samples. The genera were included in the matrix if they were in at least 50% of calves and represented at least 0.1% of the bacterial community in at least one calf. All correlations presented were statistically significant (P < 0.05), with strong correlations indicated by large circles and weaker correlations indicated by small circles. The scale colours denote whether the correlation is positive (closer to 1, blue circles) or negative (closer to −1, red circles) between the taxa and production variables. The OTU count data was subjected to variance stabilising transformation then pairwise Spearman correlations between bacterial genus and biological parameters at corresponding ages were analysed. P-values were adjusted for multiple comparisons.